Archive for January 2014


I was skeptical until I saw the phrase “nuclear mathematician”

This was in my email box this morning:

Dear Reader,

I admit, an 18.79% annual return for the rest of your life sounds too good to be true.

You have every right to be skeptical of such claims.

I certainly was skeptical when a colleague of mine told me he had developed and back-tested a system for making such profits.

But then he divulged the entire story . . . how he discovered a secret calendar that Wall Street uses to grab 250% gains, and how he teamed up with a nuclear mathematician to perfect the calendar to pick winning trades 96% of the time.

It truly is one of those marvels that “you have to see to believe . . .”

Which is why my colleague was kind enough to put a video together revealing this secret calendar, and how anyone could use it to profit.

Back-tested?  Then count me in.

Even better, the company was strongly recommended by a famous conservative newsmagazine.

Humor that went right over my head

Here’s Noah Smith, (world-renowned crusader for civility in blogosphere discourse) on Brad DeLong:

But when agents of the overgrown conservative hive-mind needed skewering, he skewered without mercy. And despite fighting against the conservative hive mind, DeLong has never become a thrall to the liberal one.

DeLong is often criticized for being mean – he did, after all, invent the “Stupidest Man Alive Award (TM)” – but I think that the exigencies of the moment justified that meanness; the Conservative Reality Bubble just had to be stopped.

And here’s Noah on The World’s Most Fanatical Open Borders Advocate (and perhaps the least disingenuous person I’ve ever met):

Screen Shot 2014-01-18 at 12.13.47 PM


Screen Shot 2014-01-16 at 10.52.40 AM

I consider myself a moderate supply-sider, however . . .

.  .  .  does this look like a supply shock?

Screen Shot 2014-01-17 at 3.14.11 PM

I’ve seen economists like John Cochrane express doubts as to whether demand-side models can explain what’s going on with the US economy.  If he means “can fully explain” then I’m completely on board.  If someone wants to argue that Obamanomics has shifted the trend line for real GDP down by 1% or so (not the growth rate), I can entertain that hypothesis.  What I don’t get is how people explain this sort of cycles without discussing AD?  Why does industrial production plunge from 101 to below 84 in less that 2 years, and then soar by 22% in the next 4 1/2 years?  Did something incredibly bad happen to the supply-side of the economy between December 2007 and mid-2009?

Believe it or not the answer is “perhaps.”  There were things like a 40% jump in the minimum wage and an unprecedented extension of unemployment insurance benefits.  Casey Mulligan has documented other policies as well.  But here’s my problem—those factors haven’t gone away. Indeed we’ve added Obamacare.  So why the steep recovery?  This is exactly what demand shocks look like–an output gap opens, and then a reversal.  Can someone explain to me why there is so much skepticism that this was an adverse demand shock?  NGDP fell.  Check.  Both RGDP and inflation slowed.  Check.  The ratio of nominal wages to NGDP rose. Check.  Lots of involuntary unemployment.  Check.  Stocks start reacting strongly and positively to TIPS spreads changes. Check.  Stocks start reacting to monetary policy surprises as if AD is the problem.  Check.

PS.  Industrial production rose at a blistering 6.8% rate in Q4.  I was one who argued that the October shutdown would be a modest negative supply-shock, and hence a slight drag on the economy.  Looks like I was wrong.  Remember that nursery rhyme—When the cat’s away the mice will play.

PPS.  The post was partly motivated by this comment by John Cochrane:

I think we’ve left the point that we can blame generic “demand” deficiencies, after all these years of stagnation.

OK, that’s vague enough where perhaps we aren’t far apart.  I agree that the trend RGDP growth rate is slowing.  But it also seems almost certain that industrial production in the US is still rising at well above trend (which is only about 1% to 2% for IP).  The unemployment rate is still falling. That tells me that we are still recovering.  Could we be overheating?  Possibly, but I don’t see any signs of it, nor do the asset markets.  AD is still a problem, that’s why we are still recovering.

Update:  Several people mentioned the mining component as possibly driving the cycle.   Manufacturing has a deeper drop and a more rapid recovery (up 23.6%.)  Here’s manufacturing:

Screen Shot 2014-01-18 at 10.16.35 AM

Is the ECB making “rookie mistakes?”

Vaidas sent me an interview with ECB board member Benoit Coeure.  Here’s the sort of quotation that I’ve made fun of in the past:

On the definition of medium term:

“There is an academic definition of ‘medium term’ which is the Milton Friedman definition. That’s 18 months. But it has always been recognized by the ECB, from inception, that the path through which inflation reverts back to the 2 percent number depends on the nature of the shock and it depends on the type of nominal rigidities that you have in the economy. In the current situation, where you have this enormous structural adjustment going on and enormous deleveraging pressures that are obviously weighing a lot on prices, contributing to the subdued price pressures, it is only normal that we see inflation coming back more slowly to the medium term objective. That’s compounded by the fact that a number of European countries are going through a relative price adjustment which is a necessary adjustment, since it’s part of regaining competitiveness. This is temporary, and should not be confused with deflation. Mechanically, this relative price adjustment weighs down on the average euro-zone inflation number. For all these reasons, inflationary pressures will be very subdued for an extended period of time. The definition of medium term is probably more extended now than it could have been in other circumstances because of the situation the euro area economy is in. And we have to acknowledge it.”

It’s hard to imagine an American macroeconomist saying it’s healthy for inflation to be running below target because the economy is so weak.  On second thought . . .

At least it would be correct to say that Paul Krugman and many other American pundits have picked on the ECB for making statements like this in the past.  So what could be going on here?

It occurred to me that this is exactly the sort of thing that people at the Fed used to say in the first few decades of its operation, when it hadn’t yet figured out what it was doing.  We went from a classical gold standard to a managed gold standard to Bretton Woods to a pure fiat regime, and each time a new approach to monetary policy was needed.  Often the Fed was stuck in its old way of thinking, old rules of thumb, and did not rise to the challenge.

You might assume that the Europeans already had plenty of central banking experience, so the ECB should have done fine.  But perhaps that’s exactly the problem.  They had lots of experience, but of the wrong kind.  Maybe they thought that running the ECB would be like running the central bank of a small open economy, whereas it’s more like running the central bank of a large closed economy.  More like the Fed.  But over in the eurozone they don’t yet realize that fact.  They are running years behind the Fed in figuring out how to do things.

Think about what’s wrong with that quotation.  The emphasis on weak economies cutting costs. That’s not a bad way of looking at things when you run a central bank in a small open economy, and need to make your economy more competitive. In that setting, however, when things get way out of line you devalue—that’s how you make the domestic economy competitive.  But the individual members of the eurozone no longer have the ability to devalue, and the ECB doesn’t seem to realize that the only way for the eurozone as a whole to become more “competitive” is to raise the inflation rate. Counterintuitive, but true.

PS.  I have a new post at Econlog.

PPS.  Marcus Nunes has a post on a different Coeure interview.


Central banks do monetary offset even while denying doing so

Mark Sadowski has some nice comments that provide data backing up a comment in my previous post.  When I was young the Fed liked to blame inflation on the fiscal authorities.  Suppose you asked the Fed the following question in early 1968:

LBJ plans to raise income taxes to slow inflation.  If he does this will you offset the effect with easier money, thus preventing a fall in inflation?

I guarantee the answer would have been no.  But they did!  Inflation rose from a little over 4% in 1968, to around 5% to 6% in 1969 and 1970.  It did fall modestly in 1971 and 1972, due partly to price controls.  However NGDP growth continued at a very rapid rate throughout the 1970s.  And note that this policy failure occurred well before the first oil shock of late 1973.  Here’s Mark:

The delusion that fiscal deficits were one of the primary causes of the Great Inflation is still very widespread. This delusion can often be cured with the simple facts.

True, fiscal policy was expansionary in fiscal years 1964 through 1968. The cyclically adjusted Federal budget balance was reduced from (-0.5%) of potential GDP in fiscal year 1963 to (-4.4%) in fiscal year 1968, and the deficit was increased annually during that time:

http://www.cbo.gov/sites/default/files/cbofiles/attachments/43977_AutomaticStablilizers3-2013.pdf

But a 10% income surtax was enacted in 1968 and remained effective through 1970. The cyclically adjusted budget balance rose to (-1.1%) by fiscal year 1970 and remained in the relatively narrow range of (-2.7%) to (-1.3%) from fiscal year 1971 through 1982. In fact despite the image of a deficit prone decade the 1970s were one of the most fiscally responsible decades on record with gross Federal debt setting a post WW II record low of 32.5% of GDP in fiscal year 1981 (President Carter’s last budget).

True between 1963 and 1968 NGDP growth averaged 8.1% and core inflation (to strip out the effects of energy prices) accelerated from 1.3% in 1963 to 4.4% in 1968:

http://research.stlouisfed.org/fred2/graph/?graph_id=155542&category_id=0

But NGDP growth was double digit every year from 1976 through 1979, peaking at 13.0% in 1978, and core inflation accelerated to 9.2% by 1980.

Then, under Reagan, cyclically adjusted Federal budget balance was reduced from (-1.5%) in fiscal year 1981 to (-4.6%) in fiscal year 1986 (the largest cyclically adjusted budget deficit since 1960 prior to the Great Recession). And yet from 1981 to 1986 NGDP growth averaged 7.4% and core PCEPI fell to 3.4% by 1986.

The Great Inflation and the Great Disinflation are perhaps the greatest examples of monetary offset of fiscal policy away from the zero lower bound in US history, because fiscal policy was relatively tight during the height of the Great Inflation, and became exceptionally loose during the Great Disinflation, exactly the opposite of what fiscalists predict.

Yes, the US was not at the zero bound, but this directly addresses Matt Yglesias’s point about central banks denying that they engage in monetary offset.  We know for a fact that in the past they have denied doing so even as they did engage in offset.  Mark has more great evidence from Japan, and some of this does occur at the zero bound:

The following is from my guest post at Historinhas “Richard Koo also misinterprets Japan´s lost decades (Part II)” on June 11, 2013:

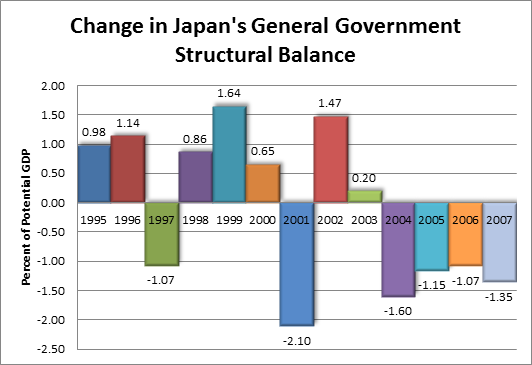
“…In my opinion the most objective way of judging fiscal policy stance is the change in the general government structural balance. The structural balance is adjusted for the business cycle and thus any changes should represent policy rather than the state of the economy. The IMF provides estimates of Japan’s general government structural balance from 1994 on so we can compute the changes from 1995 on:

http://thefaintofheart.files.wordpress.com/2013/06/sadowski2b_4.png

With the exception of calendar years 1997 and 2001 fiscal policy was expansionary during 1995-2003. Do we know anything about the fiscal policy stance prior to 1995? An excellent summary of the Japanese discretionary fiscal stimuli programs is Anita Tuladhar and Marcus Bruckner’s “Public Investment as a Fiscal Stimulus: Evidence from Japan’s Regional Spending during the 1990s” (IMF Working Paper No. 10/110, April 2010). Appendix Table 8 lists two fiscal stimuli for 1993 and one each for 1992 and 1994, so fiscal policy was obviously expansionary for the entire 1992-96 period. It also lists nine fiscal stimuli and three tax cuts during 1995-2002, but none during 2003-07. The fiscal tightening in 1997 is explained by the fact that Japan raised its consumption tax from 3% to 5% on April 1, 1997. The fiscal tightening in 2001 seems to have been passive. The expansionary fiscal policy of 2003 represents a carryover of the effects of the 2002 fiscal year, which ended on March 31, 2003.

Considering that the BOJ’s call rate wasn’t lowered below 1% until July 1995 and didn’t get below 0.25% until November 1998, Japan’s fiscal policy seems a bit backwards. Away from the zero lower bound there’s absolutely no rationale for doing fiscal stimulus unless one wants to see the spectacle of competing policy levers cancel each other out, and yet Japan did eight fiscal stimuli and three tax cuts during 1992-98. On the other hand, if one truly believes in the Keynesian concept of the liquidity trap, then one would want to do fiscal stimuli when the policy rate is pinned to the zero lower bound, and yet Japan practiced five consecutive years of consolidation during fiscal years 2003-07, a time when the policy rate was never as high as 0.5%.

So with that background out of the way, and recalling that Japan’s QE was announced in March 2001 and didn’t really kick into gear until December 2001, how did the Japanese economy do? Here’s a graph of Japans’ annual CPI inflation and harmonized unemployment rate:

http://thefaintofheart.files.wordpress.com/2013/06/sadowski2b_5.png

Note that aside from the consumption tax induced increase in 1997 Japan’s inflation rate dropped nearly every year from 1991 through 2002 and then edged upward until there was consecutive years of consumer price inflation in 2006-07 for the first time in nearly a decade. Unemployment increased nearly every year through 2002 and then dropped in 2003 for the first time since 1990, and then continued to drop every year through 2007. And it’s worth noting that even the Nikkei 225 gave its thumbs up during 2003-07, with the index rising from less than 7900 in April 2003 to over 18,000 in June 2007, which is still by far the greatest stock market rally in Japan since the beginning of the Lost Decade(s)…”

So once again, the Japanese disinflation proceeded unimpeded during the time fiscal policy was exceptionally expansionary, and came to an end when fiscal policy became contractionary. This is another excellent example of monetary offset of fiscal policy, however in this case, the latter half took place at the zero lower bound, precisely when Keynesians predict monetary policy is impotent.

The second graph is a real eye-opener.

PS.  The failed austerity of 1968-70 is one of the factors that boosted Milton Friedman’s reputation, and led to the rise of monetarism in the 1970s.