

Where to put the trend line?
There’s a now famous graph showing the big drop in American NGDP, relative to trend, after mid-2008. The slowdown was even more severe in Europe. I’ve often pointed to Australia as a country that avoided this dramatic NGDP growth decline. But commenter Declan pointed out that it sure looks like Australian NGDP crashed much like American NGDP, at least on the graph he sent me:
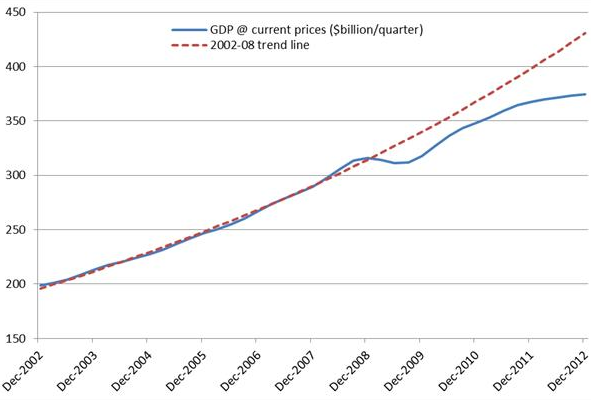
So was I wrong? Maybe, but I’m not convinced, and I’d like to know what you think. My theory is that people have their eye drawn toward trend lines that may not be real. Suppose we drew that red line slightly lower, so that 2008 was a boom period well above trend, and 2012 was back on trend.
So I did some computations, and here’s what I noticed:
Australian NGDP growth from 1996:2 to 2006:2 averaged 6.54%
Australian NGDP growth from 2006:2 to 2012:2 averaged 6.49%
Those both round off to 6.5%. That sure looks like “level targeting.” So what’s going on here, and why does the graph look so different?
I picked 2006:2 because that’s when Australia’s big commodity boom seemed to begin rapidly boosting NGDP. It grew at a 9.65% annual rate over the next 9 quarters, pushing NGDP well above the 1996-2012 trend line. Then the commodity prices fell sharply in the 2009 recession, and Australia’s NGDP actually declined a tad. Normally that would have produced a recession, but the decline was from such a peak of prosperity that it merely led to a sluggish period of slightly elevated unemployment. At least that’s what I think happened.
In contrast:
US NGDP growth from 1996:2 to 2006:2 averaged 5.5%
US NGDP growth from 2006:2 to 2012:2 averaged 2.6%
However, for the US the period around 2006:2 was probably near our peak, so I generally use mid-2008 as a benchmark; when unemployment was closer to the mid-5% range, i.e. closer to the natural rate. But the slowdown still looks very sharp.
US NGDP growth from 1996:2 to 2008:2 averaged 5.25%
US NGDP growth from 2008:2 to 2012:2 averaged 1.97%
And I think the slowdown in the US would look sharp for any plausible “before and after.”
There is probably a bit of serendipity in the Australian numbers, and given the volatility caused by commodities, as well as the probable global “Great Stagnation” now beginning, I’m not predicting Australia will keep growing at 6.5%—I’d expect somewhat slower growth going forward.
I’d welcome suggestions from commenters, and have an open mind on how to draw trend lines. But keep in mind that it’s easy to be fooled into thinking it’s “obvious” where the trend line should be, when it’s not at all obvious. When someone adds a trend line to a chart, they are subtly biasing the way you look at that chart; the way you interpret the data. I can draw a line to make it look like there was a big boom, or a big recession, depending on how high up I draw the trend line. You might think some sort of “least squares” approach is objective, but it’s not—as you still need to decide which years to include. I’m pretty sure Tyler Cowen would say even mid-2008 was above trend, in retrospect.
And of course trends change over time when central banks are not doing NGDPLT, which makes things even trickier. Even the “Great Moderation” in the US saw a subtle drop in the trend line from the 1980s to the 1990s.