

Random links
[I’ve received complaints that I don’t do enough posts on monetary policy. I have a long one over at Econlog with zero comments, while my moronic Trump posts get dozens of comments.]
1. Here’s Janan Ganesh:
Because, in Britain, someone who is nationalist in general will be anti-EU in particular, the Anglo-American intelligentsia tends to assume the same of Europeans. In fact, millions are able to decouple the two things.
Brexit helped. If Nato owes its second life to Russia, the EU is forever in Britain’s debt. Its great adventure of 2016 has gone badly enough to discourage the rest of Europe from even entertaining the same idea. Apart from its co-authorship of the single market in the 1980s, Brexit stands out as the UK’s kindest service to the European project. (Both happened under the Tories, which will gall that party to a degree that no landslide election defeat ever could.) What a parting gift. And how true, on such different levels, when Brussels says: “You shouldn’t have.”
2. Here’s Ross Douthat:
I wrote about this in the context of Biden’s “save democracy, vote Democrat” rhetoric before the 2022 midterms, but clearly the point merits new elaboration. Time and again, from 2016 to the present, the Democratic Party has treated Trumpism not as a “civic emergency” but as a political opportunity, a golden chance to win over moderate and right-leaning voters with the language of anti-authoritarianism while avoiding substantive concessions to these voters and actually moving farther to the left.
3. American software is eating the world:
By March 2008 America had entered recession and its financial crisis was under way. The country’s stocks accounted for less than 40% of the world’s total stockmarket capitalisation.
Fast-forward to today and things look rather different. America’s share of the world’s stockmarket capitalisation has climbed pretty consistently over the past decade and a half, and sharply this year. It now stands at 61%. That is astonishing dominance for a country which accounts for just over a quarter of global GDP.
4. Many people seem to think Trump is the same guy as in 2020, or 2016. I think this is related to the famous example of the frog in the pot, not realizing that the water is getting hotter and hotter. The Economist points out that there was a time when even Republicans like Trump condemned the Jan. 6 insurrectionists. Now, Trump is campaigning on the theme that they were actually heroes. He calls them warriors:
To call them warriors is not simply to insist their cause was just and that they were somehow tricked into entering the Capitol with the guns, bats, knives and other weapons that Mr Trump once maintained they did not have; it is not just to ignore or minimise the violence that day, which resulted in five deaths; it is not even to shift the blame for that violence to others, whether police officers (some 140 of whom were assaulted), or Ms Pelosi (whom the rioters were hunting, and who can be seen on video from that day urging Mr Trump’s acting secretary of defence to dispatch troops to the Capitol). It is instead to praise the people who attacked the Capitol precisely—definitionally—for their capacity to wage war. That is to move the understanding of what happened on January 6th, at least for Mr Trump’s supporters, onto new and even darker ground.
There was a moment, back in the mists of 2021, when just about everyone in the mainstream of American politics recoiled in shock from the mayhem of January 6th. They agreed that attacking the Capitol was wrong, and that Mr Trump, to some degree, was responsible. Even Mr Trump said so,
The Trump of 2020 was considerably more authoritarian than the Trump of 2016. And the Trump of 2024 is considerably more authoritarian than the Trump of 2020. Deep down, Trump hasn’t changed. Instead, he’s realized that America has changed. In 2024, it’s OK to run for president celebrating violent insurrectionists who tried to overturn an election.
5. If you haven’t been keeping up with developments in solar power, you might wish to check out a new essay in The Economist. It seems that solar energy prices are plunging so low that entirely new possibilities are opening up:
It is possible that batteries might move electricity in space as well as time. Lawrence Berkeley National Laboratory estimates that there are 2.6tw of generation and storage capacity queuing up for grid connections in America—enough to double the country’s installed generating capacity. This queue contains a full terawatt of solar power. SunTrain, in which Dr Carlson’s firm, Planetary Technologies, is an investor, sees this as a market for batteries with wheels.
The company plans to use solar farms in places that have little to recommend them other than a railway line nearby as filling stations at which to charge heavy but cheap batteries built into goods wagons. A 100-car train similar to the ones that currently carry coal east from Wisconsin could deliver 3 gigawatt-hours to users. Dr Carlson describes a utility-boss’s jaw hitting the floor when he proposed that, instead of a multi-decade planning battle to build a high-voltage transmission line, SunTrain could meet the utility’s power-import needs with a couple of trains a day.
6. It’s a mistake too focus too heavily on US politics, as you may miss the bigger picture:
When the Alternative for Germany (AfD, from its German initials) was launched in 2013, it was a pro-business, classically liberal party created by German intellectuals opposed to the single European currency. Hans-Olaf Henkel, a free-market enthusiast and former boss of the bdi, the main German industry association, was a founding member.
Then, in the space of a few years, the afd turned into an anti-immigrant, populist party toying with Dexit—Germany’s exit from the EU. Mr Henkel quit in 2015. German bosses turned their backs. Despite being generally reluctant to voice political opinions, many came out strongly against the afd ahead of the election to the European Parliament on June 9th.
Remember when Tea Party was sort of libertarian?
7. More evidence that the War on Drugs was a catastrophic mistake:
Some fear that super-strength commercial pot is fuelling mental-health breakdowns. But the evidence for this is thin. An extensive study published last year in the journal Psychological Medicine found that people who live in states where weed is legal consume more than their identical-twin siblings in states where it is not. But they are no more likely to suffer mental, physical, relationship or financial problems. Another study looked at health-insurance data to see whether states with legal cannabis saw more claims for psychosis. The authors found no relationship.
BTW, Brian Albrecht has an interest post on the opioid epidemic.
8. Worried about abuse of power? Consider the following:
Nowadays the deployment of troops and suspension of liberties on American soil by the federal government is hard to imagine. Yet if a tyrannical president wished to do so, he would have the power to send in the troops under the Insurrection Act. This law, dating from 1807, gives the president the authority to deploy the army or the navy in the case of a domestic uprising or where federal law is being ignored. The act states that this can be done when lawful, without defining when that means. “It’s a loaded gun for any president. There are practically no constraints,” says Jack Goldsmith, a former attorney-general and current scholar of presidential power who is part of an effort to reform the act.
But have no fear, the Supreme Court will certainly not allow any president to be above the law.
9. Some are claiming that after previously deciding not to deflect bullets away from JFK and Bobby Kennedy, God did decide to deflect a bullet away from Trump’s head. Because I am not religious, I’ll refrain from offering an opinion on this hypothesis. But I will say that it reminds me a bit of an old Onion headline:
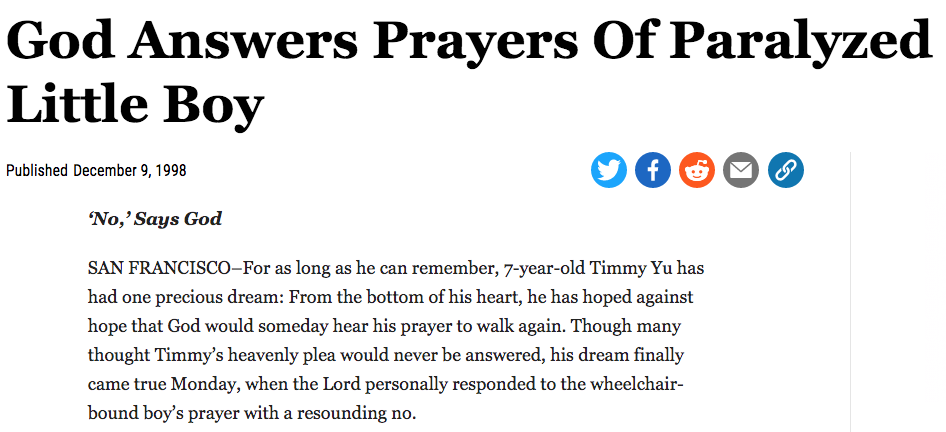
.


