

About those struggling middle class Americans
I’m a bit of an extremist on saving. That partly reflects my supply side views—government policy discourages savings in 100s of ways. It partly reflects the fact that successful economies like Singapore and Switzerland tend to save a lot. And it partly reflects my (patient) personality. I’ve been in all 5 quintiles at various stages of my life, and can always save money at any income.
I often get into debates with commenters, and eventually it reaches the point where I’m told Americans are too poor to save. I don’t get it. Isn’t America the richest country in all of world history? How can we not afford to save? It also makes me think of my frequent trips to China, where people earning about $10,000 on average are able to save 50% of their incomes.
Lots of our economic problems, from excessive health care costs to excessive student loan debt to the housing crisis, are partly caused by insufficient saving.
Now Businessweek reports that even most “upper-middle-class Americans” don’t save anything:
Just 45 percent of upper-middle-class households (income from $75,000 to $99,999) saved anything in 2012, according to the Fed study. That means the other 55 percent didn’t save for a house, retirement, or education. About 16 percent spent more than they earned and went further into debt.
Now you might object that a family making $80,000 or $90,000 a year isn’t really “upper-middle-class.” It’s middle class. And I’d agree with you. But I’ll only agree with you if you agree that this shows the income distribution data doesn’t show what most people assume it shows.
To be fair, the income distribution data used by the right is often just as meaningless. Remember hearing about all those people who “escape poverty?” Lots of them are like me—struggling grad students moving up to fat and happy professional careers. The NYT reported that 73% of Americans spend part of their life in the top 20%. What’s the matter with Kansas? No, what’s the matter with intellectuals who don’t understand why average Americans don’t favor higher taxes on the top 20%.
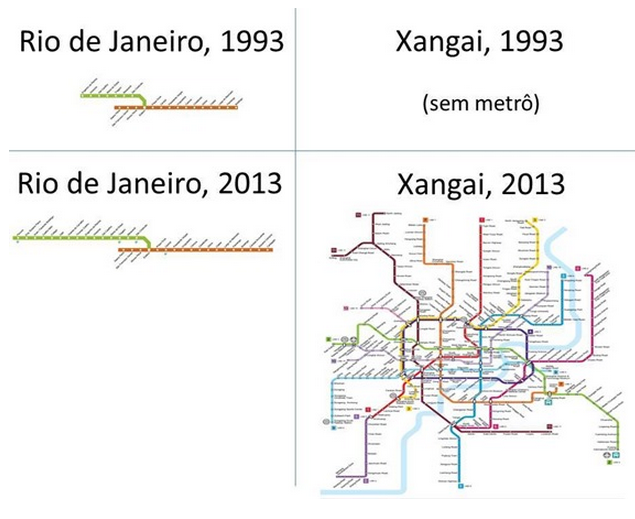
PS. I recently did a post comparing Brazil and China. If you wonder where all that Chinese saving goes, check out this map provided by Matt Yglesias, which compares growth in the Rio and Shanghai subway systems since 1993. By 2025 Shanghai’s will probably double again.
Of course not all the Chinese saving is invested wisely.
PS. The Yglesias post has some other interesting graphs.
Tags:
27. August 2014 at 06:51
http://www.imf.org/external/pubs/ft/wp/2014/wp14148.pdf
‘This paper looks at the empirical record whether big
infrastructure and public capital drives have succeeded in accelerating economic growth in low-income countries.
It looks at big long-lasting drives in public capital spending,as these were arguably clear and exogenous policy decisions. On average the evidence shows only a weak positive association between investment spending and growth
and only in the same year, as lagged impacts are not significant. Furthermore, there is little evidence of long term positive impacts. Some individual countries may be exceptions to this general result, as for example Ethiopia in recent years, as high public investment has coincided
with high GDP growth , but it is probably too early to draw definitive conclusions. The fact that the positive association is largely instantaneous argues for the importance of either reverse causality, as capital
spending tends to be cut in slumps and increased in booms,
or Keynesian demand effects, as spending boosts output
in the short run. It argues against the importance of long term productivity effects, as these are triggered by the completed investments (which take several years) and not by the mere spending on the investments. In fact a slump in growth rather than a boom has followed many public capital
drives of the past. Case studies indicate that public investment drives tend eventually to be financed by borrowing and have been plagued by poor analytics at the time investment projects were chosen, incentive problems and interest-group-infested investment choices.’
Then comes the descent into a fantasy;
‘These observations suggest that the current public investment drives will be more likely to succeed if governments do not behave as in the past, and instead take analytical issues seriously and safeguard their decision process against interests that distort public investment
decisions.’
27. August 2014 at 07:38
What is the macro impact of low savings?
High interest rates? US has a low savings rate and low interest rates…
Low economic growth? Many models suggest that low savings boost growth (“the paradox of thrift”). Really they suggest that low savings rates mean higher MPC, which means higher “fiscal multipliers”. These same models would also suggest greater sensitivity to income shocks, but that isn’t how they spun it in intro to economics.
Higher economic cyclicality / less stability?
Higher Velocity / greater AD sensitivity to small shifts in M?Less predictable velocity? … Shifts in M may or may not have the same impact on P and Y.
27. August 2014 at 08:22
Why should Americans save (or accumulate wealth)? Everyone has a million dollar annuity waiting for them, when they become seniors (social security and medicare). Having savings reduces college financial aid and makes one vulnerable to lawsuits and takes away the benefit of bankruptcy. Heck, some liberal may confiscate your wealth someday. Financial responsibility is for suckers! That said, I still like the idea of a wealth tax.
27. August 2014 at 08:57
“Now you might object that a family making $80,000 or $90,000 a year isn’t really “upper-middle-class.” It’s middle class. And I’d agree with you.”
This irks me for the simple reason that “Middle class” doesn’t really correlate with a number without an accompanying precise geographical indicator as well. It’s the same reason that $10.10 minimum wage sounds about right to someone in most large cities, whereas the owner of a restaurant in a town with 350 people in the middle of Minnesota might not make that much, and lives a “middle class” lifestyle. In the same town, someone making $90k is likely upper class, regardless of what the Federal or even state government says the number should be. Most (all?) states are too large to reasonably choose those numbers, much less the entire federal government.
27. August 2014 at 09:22
Scott,
Off topic. Don’t know if you’ve heard,
“Foreign-funded hospitals planned in seven Chinese cities or provinces”
http://www.scmp.com/news/china/article/1581138/china-giving-foreigners-100-cent-ownership-hospitals-first-time
27. August 2014 at 11:48
Mark Sadowski, Please Come Back!!!!!!
27. August 2014 at 12:06
Is this a type-o?
“No, what’s the matter with intellectuals who don’t understand why average Americans don’t favor higher taxes on the top 20%.”
Patently false, of course.
http://m.huffpost.com/us/entry/1677826
27. August 2014 at 12:17
Yikes!!!!!!
“The Cantillon Effect (And The Inevitable Demise of Financials)”
http://www.valuewalk.com/2014/08/the-cantillon-effect
🙂 🙂
27. August 2014 at 12:21
Scott,
It also greatly depends on regional cost of living indexes. A Chinese citizen is able to save on a $10000 a year because costs of living are vastly different. Meanwhile, Americans will find it impossible to live on, let alone save on 10,000 dollars a year, without government assistance or going into debt
But, income is meaningless 🙂 so what do I know?
27. August 2014 at 12:57
Very good post!
27. August 2014 at 13:09
“This irks me for the simple reason that “Middle class” doesn’t really correlate with a number without an accompanying precise geographical indicator as well.”
Everyone in America is middle-class — or thinks of themselves as middle class.
27. August 2014 at 13:37
Sumner makes a great point in this blogpost.
The reason we hear so often that the poor cannot save, is that in the US there is a very, VERY strong sense of entitlement that is much less pronounced in other countries. We have to deal with people whose heads are in the clouds. Everyone is supposed to not have to live in a cage like some do in Hong Kong for example. It isn’t “humane”.
So the minimum standard for what constitutes “tolerable” poverty is much much higher here, where of course people can more afford to be unrealistic like that.
One of my pet peeves. Many of the people who complain the poor in the US can’t save haven’t travelled to other countries and don’t know just how wealthy they are. Lots of bubbled, spoiled people.
I was able to save making minimum wage when I was living on my own in a shitty apartment. But noooo, I must feel sorry for the yokels who make peanuts but nevertheless have 3 kids. On welfare. It sends shivers down my spine.
On the other hand, there are those who are heavily indebted because of sudden unexpected healthcare problems. Sure, these people have a very difficult time saving. But even there is not impossible. Heavily indebted people are capable of moving to a shitty apartment, and paying off debt AND saving besides. Many are capable of eating a lot less and save from the lower consumption on food.
Too much guilt tripping. I can’t even say what I said above in public.
27. August 2014 at 14:24
I agree about personal savings, but the infrastructure example suggests a failure of the public sector to invest in projects with NVP that are positive at the interest rate at which governments can borrow (especially when taking into account the shadow prices of inputs during a recession).
27. August 2014 at 15:36
Saving is good. But am I crazy to think that if our government dramatically increased spending on long term or undirected research that we might see the cost of college increase, the college wage premium increase, the saving rate decline, and also an increase in overall growth?
27. August 2014 at 15:40
excellent blogging. Americans should save more. I always managed to save money even on modest income but – the world is now in it glut of capital. The US economy suffers from a lack of demand. I believe in QE – but does borrow and spend on capital projects (Shanghai) sound so bad?
Note on capital spending and measured GDP: Some aspects of modern life—air pollution and commute times, for example—are not captured by GDP measures.
27. August 2014 at 18:02
The Singaporeans have a high savings rate because the government there mandates a lot of forced savings for health care and retirement – it’s also the reason why their social spending numbers are so low as a percentage of GDP. The Chinese have a high savings rate because the safety net sucks and unless you have a good farm or “iron rice bowl” job, a disease or old age could wipe you out without a ton of savings (especially with the low birth rates and few per-couple children).
That said, the US savings rate could be higher. It was usually in the 8-12% range before the late 1980s, and like that for decades.
27. August 2014 at 20:54
“The NYT reported that 73% of Americans spend part of their life in the top 20%.”
I realize this isn’t the main point of the post, but I can’t pass that claim without comment. Facts like this puzzle me greatly. There’s no reference or link, so I can’t look into the details. Where could the numbers come from? Current children and young adults have not had time to cycle through quintiles. Perhaps this claim is based on a historical study, looking at people who are now middle aged (or older), and what their incomes were at all points in the past. If so, a more accurate claim would be something like, “Of people born in the 1960’s, 73% have been in the top quintile of income at some point in their lives.” But that is clearly less relevant to today, and much less reassuring.
You see my point: claims about life cycle earnings require multiple decades of evidence. But those of us who worry about the “struggling middle class” are worried about economic paths to success now in comparison to the not so distant past. Will 73% of today’s teenagers sample the top quintile some day? Is the economy changing in ways that make that less likely?
Facts about the current wage distribution seem more clear, more timely, and more relevant. I think the evidence is very strong that that are fewer middle income jobs now than 10 or 20 years ago, replaced by more dollars at the top of the wage distribution and more service jobs in the bottom half.
This paper (http://www.nber.org/papers/w18901) states that the 2012 US economy has fewer jobs that require high cognitive skills (e.g., college education) than the 2000 economy had. I confess I haven’t dug into the details, but at least I can imagine how the study would be done (in contrast to your secondhand claim). The study seems straightforward and exactly relevant to what’s happening now.
27. August 2014 at 22:14
Scott, in the sidebar, was “A very simple model of money, NGDP, and business cycles” supposed to link to the same post (the reply to Tony Yates) as “Misconceptions about market monetarism”? Because you’ve got two links to the same post there, one of them might be wrong.
28. August 2014 at 04:02
Maxk,
I think the key to understanding that ny times income stat would come from looking at how many Americans spent 1 year in the top quintile as opposed to 2. I’d assume a lot of what we are seeing there is the way housing works as a government subsidized savings vehicle for a lot of families. The year you sell your larger home in a good school district and buy a condo and a bunch of ETFs you are a very rich person according to the IRS.
28. August 2014 at 04:21
Yep. I remember in one of my old posts, where I got the most desperate pushback from commenters, was one where I argued that the “too poor to save” meme was wrong because it ignored the equally compelling argument that if one was likely to be equally poor tomorrow one was too poor *not* to save.
The only case where the “too poor to save” idea does have some force is where the Malthusian constraint bites, and if we consume any less today we reduce our chances of being alive tomorrow. In that case, current consumption is an investment, and hence is saving.
28. August 2014 at 04:58
Nick,
Sounds plausible. But if so, that would confirm my larger point that the statistic is dependent on historical circumstances and doesn’t tell us anything much about the current economy. If there are fewer decent middle class jobs today, there will be fewer people who can build housing wealth, and then strike it rich by cashing out in the next housing upturn.
28. August 2014 at 05:06
Patrick, Good point.
Doug, You said:
“What is the macro impact of low savings?
High interest rates? US has a low savings rate and low interest rates…
Low economic growth? Many models suggest that low savings boost growth (“the paradox of thrift”).”
There are no models that suggest a low savings rate boosts long run growth. None. The important negative impacts of low saving are microeconomic problems, like bad public policies.
Don, That’s why I don’t like (unfunded) Social Security.
Peter. Yup, income is meaningless.
Absolutezero, Yes, I saw that.
Benny, No typo, and true.
Jason, I was using PPP figures.
Thomas, The Chinese public sector knows how to invest, the US public sector has forgotten how. Our government can’t be trusted with tax money. Over here we need to privatize airports, Amtrak, etc, and see what the private sector can come up with.
Nick, You are not crazy at all. I prefer private investment.
Brett, I’ve done many posts on Singapore. The Chinese save a lot even when they live in other economies like the US. Chinese in America who are poor tend to save–they don’t plan to be poor forever.
maxk, The study cited by the NYT is about income, not wages. Income simply doesn’t mean what people on the left assume it means. It’s not something to be used to measure economic inequality. Life cycle effects are HUGE (then and now.) The US is still an overwhelmingly middle class country, with living standards that get higher and higher. (Use my search box to find it, I’ve mentioned it before with links.)
Saturos, Thanks. I no longer recall the posts I was trying to link to. I’ll try to figure it out. Maybe Travis recalls, he has a better memory than I do.
Nick, Yes, people get emotional about saving.
28. August 2014 at 05:11
@Nick
“The year you sell your larger home in a good school district and buy a condo and a bunch of ETFs you are a very rich person according to the IRS.”
I seriously doubt that for the simple reason that, since 1997, gains on the sale of a principal residence have been excludable from income (up to $250K for singles and $500K for joint returns). Prior to that up to $125K of gains were excludable for those over 55 years of age. (I won’t go into the whole history, but there were also gain deferrals prior to that, too).
That raises the question of whether the NYT statistics captured that and I’m pretty sure they don’t because those exclusions don’t appear as adjusted gross income (AGI) in the IRS Statistics on Income (SOI). While the “rich” tend to exclude more gain than the “non-rich”, it would seem very likely that the gains excluded by the “rich” are a smaller percentage of lifetime “income” than for others. This is due, among other thins, to the cap. If the NYT (and other) statistics would include this item, one would see even more enter the top 20 percent in at least one year than they reported.
I have not dug through the footnotes on Piketty’s book, which relies on the IRS SOI for his US income data and inequality conclusions, but I’d be pretty sure that he did not even attempt a proxy for the failure of AGI to include this big item. Even though I have not, it appears that Alan Reynolds has:
http://online.wsj.com/articles/alan-reynolds-why-pikettys-wealth-data-are-worthless-1404945590
28. August 2014 at 05:48
Vivian,
I think we agree. I should watch my words more carefully. My bet is that the times is using IRS *generated* statistics that imply large one time gains for many middle class people, not that those people are facing a huge one time tax burden in the real world.
28. August 2014 at 06:11
Yglesias on housing and zoning:
“The biggest thing that blue states are screwing up”
http://www.vox.com/2014/8/28/6063679/the-biggest-thing-the-blue-states-are-screwing-up
28. August 2014 at 06:24
Scott,
Thanks. I did the search and found the reference (http://www.nytimes.com/2014/04/20/opinion/sunday/from-rags-to-riches-to-rags.html?_r=0), a Sunday Review commentary by Mark Rank in which he quotes joint work with Thomas Hirschl. I tried (and have so far failed) to find a paper by them with those exact numbers. (Did find a paper from 2001 that studies longitudinal data that starts in 1968. I bet that the quoted numbers are based on the same data, carried forward another dozen years.)
The Sunday Review says that the result is from “44 years of longitudinal data” (good fit to 1968 start), so I think my general comment still holds. When people talk about the currently struggling middle class they are talking about the effects of recent economic trends. I’m conjecturing that the world is changing and the Rank & Hirschl 73% may not apply going forward.
You say, c’mon, things haven’t changed that much. We’re still a middle class country. Life cycle effects are HUGE.
I say, but look at recent changes in the wage distribution.
You say, wages aren’t income.
So I say, for the middle class group that I’m thinking of (i.e., not professionals), income will closely track wages. That has to be true for most of us, right?
28. August 2014 at 11:21
Vivian, Good points. Capital gains are a problem for all sorts of reasons. Capital losses are limited, inflation is not taken into account, taxes apply to sales, not actual gains (which occur gradually over time.)
Maxk, Just to be clear, I think wages are the right variable (or less bad than income), and I certainly agree they are becoming much more unequal. My complaint was with people who use income data, which lumps together wage and capital income, even though economic theory says that makes no sense (if you are interested in welfare comparisons.)
My best guess is that if the figure has fallen from 73%, it’s into the 65-70% range, which still supports my point. But of course I can’t prove that.
Ideally we’d want to look at consumption. Liberal economists believed that until about 2006.
28. August 2014 at 11:52
@Nick
Nick, I’m not sure we do agree. The point is not that the gains are exempt; it is that they are excluded from the publicly available statistics. Of course, it is almost certain that the statistics cited by the NYT (from the 2014 Hirschl/Rank book “Chasing the American Dream”) are based on IRS “generated” statistics. The point is that the gains excluded under section 121 (home sales) are not part of the IRS SOI released to the public. Thus, those gains would almost certainly be excluded from the percentage of folks who, at some point, are in the top 20 percent of “income” in a particular year. The exclusion of this type of gain and the inclusion other other types of “capital gains” (e.g., stock sales) strikes me as rather arbitrary and misleading. Why should a person whose gains and resulting equity from a house be treated differently from a person (say, a renter) with the same gains and resulting equity from a stock portfolio?
29. August 2014 at 21:44
What NYT has included in its “only 45% of upper-middle-class households … saved anything in 2012…” are 401(k) and such counted? What about Social Security? (I understand it’s basically a tax, but with a promise of repayment down the line it’s also a temporal money transfer, that is savings)
31. August 2014 at 11:24
America’s savings rate was never very high:
http://research.stlouisfed.org/fred2/graph/?g=Ikn
1. September 2014 at 10:36
D.O. Social Security is not saving because the money is not put into a trust fund, but rather immediately lent out.
1. September 2014 at 14:31
SS is actually immediately spent, not lent.
The SS receives money from the citizenry, the surplus is then “invested” in special non-tradeable treasuries, and the treasury immediately spends the money to finance existing voter bribery.
SS is perhaps the biggest, most expansive example of fraud in the history of the country.
2. September 2014 at 16:05
I don’t have the economics education and it is rather presumptuous of me to contradict Prof. Sumner, but isn’t generalized meaning of savings is “deferred consumption”? From Wikipedia I see that in 2012 net change in SSA reserves was +85.6 billion for OASI and -68.5 bil. for the rest. So the net savings from the program are minuscule…
6. September 2014 at 18:01
D.O. Suppose S.S. was ended today, would be be able to pay the promised benefits out of the “trust fund?”