

The stock market cares a lot about the budget fiasco
In this post, I’ll talk about two examples of how people tend to misinterpret market reaction to macro news.
You see lots of commentary to the effect that the stock market doesn’t care very much about the budget fiasco and/or that these budget fights only have a temporary impact on stock prices. If so, why wouldn’t investors buy stocks during a budget fight and sell them once the dispute is resolved?
At first glance, it seems like this strategy would work. And it often would work. But Eugene Fama and the EMH tell us that it’s too good to be true. Let’s take the 2% stock market rally last Friday on growing optimism of the budget deal. What does that stock market rally tell us? We can’t be sure, but the most likely explanation would go long following lines:
1. As of last Thursday investors saw a nontrivial risk of budget Armageddon. Let’s assume that budget Armageddon was expected to reduce stock values by 20%. That’s obviously huge, so in that case it would be wrong to say the stock market doesn’t care about the budget fight.
2. Let’s assume that last Thursday investors saw a 15% chance a budget Armageddon. That’s small, but obviously still significant. By Friday evening the perceived risk of default may have fallen to 5%. With 10% less chance of budget Armageddon that would reduce stock prices by 20%, stocks rallied by 2%. Of course these numbers are merely illustrative.
3. Changes in current stock prices are generally mirrored in changes in future expected stock prices. Thus if budget Armageddon had occurred and stocks had fallen 20%, then future expected stock values would also fall by roughly 20%. The effects are not temporary. That’s why even a 2% stock market rally is significant.
I am very sympathetic to the view that market setbacks in response to short-term crises are temporary. It certainly looks that way. However it’s a dangerously misleading way of looking at markets. Consider the sharp market “correction” of mid-2011. Stocks fell by nearly 20% during the euro zone crisis. When we look back on this period it merely looks like a blip in a powerful four-year bull market. But of course that’s not how it looked at the time.
David Beckworth has a post comparing US and euro zone and GDP growth over the last decade:
What is puzzling to me is how anyone could look at the outcome of this experiment and claim the Fed’s large scale asset programs (LSAPs) are not helpful.
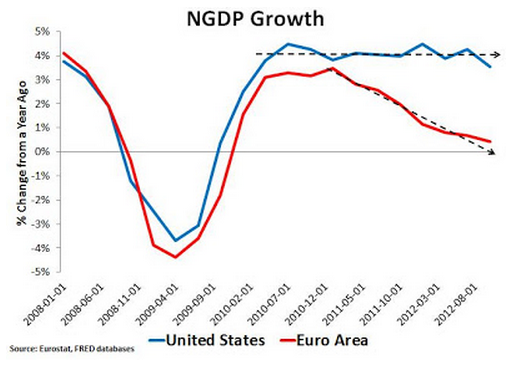
Note that although the euro zone and the United States have done roughly equal amounts of “austerity,” aggregate demand in the US has grown much faster than in the euro zone since 2011. And this difference largely explains the huge unemployment gap that has opened up between the two regions. Here’s Lars Christensen:
while the US is slowly getting out of the crisis things have in fact gotten worse and not better since ECB’s first rate hike in April 2011.
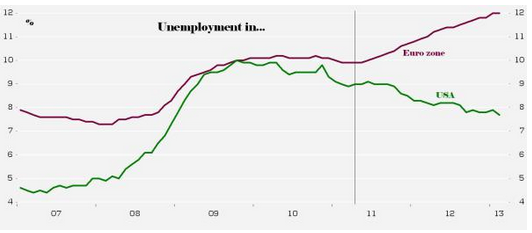
So the US and the euro zone have done roughly equal amounts of austerity, but very different monetary policies. As a result a nearly 5% gap has opened up between eurozone and American unemployment rates. And yet how often do you hear people say that QE is helping Wall Street but not Main Street? And they say this even though there is no plausible economic model where monetary policy could boost stock prices but not aggregate demand.
People get fooled by the fact that stock prices have recovered after each dip during the powerful four year rally. Thus it’s hard to see what the stock market was worried about during 2011. But if we look at Europe as a counterfactual, then the 20% dip in stock prices makes much more sense. The market might’ve been fearful that the US would also suffer a double dip recession. When it became clear that was not going to happen, stocks rallied. The double-dip recession that never happened in the US is sort of like the dog that didn’t bark in the Sherlock Holmes story, easy to overlook.
PS. Just back from Switzerland, I’ll catch up on the old comments.
Tags:
16. October 2013 at 07:01
Hmm, this would have been a good opportunity to discuss fama vs shiller and why Shiller’s claim that price variance is to high for markets to be rational is premised on e false assumption the risk premia is constant.
It’s precisely the instability such as can be caused by 435 people or 12 people whipping the policy levers around wrongly that leads to the price swings. Luckily the US has always managed to revert to reasonable policy eventually.
16. October 2013 at 07:18
Scott,
Let’s say a deal doesn’t pass,
What would be the Fed’s options?
Do you think Obama is lying about the 14th not being an option?
16. October 2013 at 07:36
I disagree. The market doesn’t care about budget issues because the market knows they will get resolved at the last minute.
The market dropped 5% after the September Fed meeting for the same reason it dropped 5% after the November 2010 Fed meeting (when QE2 was announced) and it dropped 7% after the September 2012 Fed meeting (when QE3 was announced), which is buy the rumor of a monetary policy change and then sell the news. There will always be something else going on in the background that gets blamed for the drop, but whatever that is doesn’t really matter. It’s just a short term scapegoat to try and explain the drop because CNBC and financial media has to have an explanation for every move the market makes (the scapegoat after the September 2012 Fed meeting was Mitt Romney’s election loss; I can’t recall what the scapegoat was back in November 2010).
I didn’t think of taking my money out of U.S. stocks for even a nanosecond during this alleged budget crisis. Why? Because I knew the Fed WOULD NOT drop the ball like it did in 2008, especially with Janet Yellen as the new chair. When it comes to stock prices, it is monetary policy, monetary policy, monetary policy, all the time.
16. October 2013 at 07:48
A lot of people reference the 2011 debt ceiling fight where the S&P500 dropped 15%. The funny thing is that half of that drop occurred in the days leading up to the deadline and half of the drop came after a deal was struck. This is how easily conventional wisdom can develop that is 180 degrees wrong.
16. October 2013 at 07:50
The US clearly out-performed Europe and most of the rest of the world following the last debt ceiling crisis in mid-2011. Here’s a New York Times story on it:
http://www.nytimes.com/2013/10/12/business/economy/a-tale-of-two-recessions-and-world-markets-turned-on-their-heads.html?adxnnl=1&adxnnlx=1381937862-eS5hZWKcg1SlyGkh45kJWg
Of course, it was just at that time that US shale oil production began to soar. A coincidence?
I’ll be presenting at the Woodrow Wilson School at Princeton University 1 pm next Thursday with a talk entitled, “Oil and Economic Growth: A Supply-Constrained View”. I’ll be walking through the differences between demand-constrained (traditional) and supply-constrained models, and the implications for GDP growth and oil industry spend on exploration and production. It will be interactive, somewhat academic, but should be accessible to the non-specialist. It’s open to the public. Economists are welcome–I’ll be presenting a model you haven’t seen before.
16. October 2013 at 07:52
Actually, I take that back. The S&P500 dropped about 3% between when the deal was announced and when it was officially signed into law. So, most of the drop came after the deal was done.
16. October 2013 at 08:05
It’s just noise;
http://finance.yahoo.com/echarts?s=%5EDJI+Interactive#symbol=%5Edji;range=3m;compare=;indicator=volume;charttype=area;crosshair=on;ohlcvalues=0;logscale=off;source=undefined;
16. October 2013 at 08:07
I would say that most market participants thought that the “Shutdown” was only a mild influence on future NGDP, but a default would have been much greater than a 20% hit. However the probability of default has been gauged at less than 1% increasing to about 1% and then falling to less than 1%
16. October 2013 at 09:18
Steven Kopits wrote: “Of course, it was just at that time that US shale oil production began to soar. A coincidence?”
No, it’s not a coincidence. The fed has been able to print like crazy without inflation or currency implications to its “black gold standard”. The ECB has no such option, easier money would help Europe a little, but not as much as assumed.
The Fed’s mistake in 2008, was assuming that the supply shock would get WORSE (inflation fears) even though the evidence was already readily available (and embedded in TIPS) that the supply shock was about to dramatically improve.
PLEASE, how do I access this presentation without travelling to Woody Woo?
P.S.
Will you be inviting Krugman? He could use a new perspective…
16. October 2013 at 09:20
Maybe the financial markets have access to the NY Times historical data base;
http://hisstoryisbunk.blogspot.com/2013/10/ballast-from-past_16.html
That’s just one of many articles about the maneuvering of Tip O’Neill, Bob Dole and Ronald Reagan. Eventually resulting in Gramm, Rudman, Hollings. I especially like this line;
‘… nobody on Capitol Hill or in the Administration disputes the fact that the current [debt] level needs to be raised.’
16. October 2013 at 09:28
“Let’s take the 2% stock market rally last Friday on growing optimism of the budget deal.”
A famous person once said, “never reason from a price change.” The average daily volatility of the market is 1% (at least that is what my memory tells me; I haven’t check that in a while), so a 2% move is not unexpected. It could be that the rumors of a deal bumped the market 1% while randomness bumped another 1%. When you get much more than 2%, then pay attention to the “cause”. Otherwise you sound like a talking head on CNBC.
Markets do care about the debt, but generally don’t think it likely that the US will actually default. Politicians are rational animals, even if they seem irrational. The budget fight is about symbolism, not expected outcomes. And there are differing opinions on the magnitude of the impact.
16. October 2013 at 09:31
Edward, The Fed should ease policy, but it would not fully offset the shutdown, which also has supply-side consequences.
Scott N, If you were right, it would be incredibly easy to get rich. And it’s not incredibly easy to get rich. Therefore . . .
kebko, Good point.
Steven, You said;
“Of course, it was just at that time that US shale oil production began to soar. A coincidence?”
Yes, a coincidence.
Doug, The specific numbers are less important than the general point.
16. October 2013 at 09:38
One of the most expensive books in my library is a very old, illustrated edition of Kipling’s Just So Stories for Little Children . I think it has a chapter on short term movements in certain market indices.
16. October 2013 at 09:49
Patrick Sullivan,
I award you the Internetz for one whole day!
16. October 2013 at 09:54
“”Of course, it was just at that time that US shale oil production began to soar. A coincidence?”
Yes, a coincidence.”
Sadly, even supply-siders don’t believe in supply side economics, if it conflicts with anti-carbon ideology.
What both Steven Kopits and Scott Sumner are omitting, is that shale GAS (it’s not just oil) has added the equivalent of 2 million barrels per day to US energy supply since 2008. This is the equivalent of a domestic Iraq. So we’ve added one Iraq on the oil side, and a second Iraq on the natural gas side.
This has allowed the un-stranding of previously stranded capital in the housing, auto, manufacturing and chemical sectors of the economy. It’s also improved the US current account by at least 1% of GDP DIRECTLY, through reduced imports, another 1% or so through lowered price, and probably an additional 1-2% through domestic manufacturing. I’d like to see someone estimate the multiplier effects of this as it flows through the service economy.
16. October 2013 at 10:12
Scott,
“Note that though the euro zone and the United States have done roughly equal amounts of “austerity,” aggregate demand in the US has grown much faster than in the euro zone since 2011.”
And
“So the US in the euro zone have done roughly equal amounts of austerity, but very different monetary policies.”
Yes, roughly equal, but even according to this Spring’s IMF Fiscal Monitor the US had done more during 2011-13 than the eurozone. According to the Fall IMF Fiscal Monitor, which just came out, the gap has opened even wider.
The change in the general government cyclically adjusted primary balance (CAPB) as a percent of potential GDP is Krugman’s preferred measure of the degree of fiscal austerity, and it is the measure that David Beckworth has come to rely on. This Spring the sum of the differences for the US and the eurozone during the calendar years 2011, 2012 and 2013 was 4.0% and 3.8% of potential GDP respectively. This Fall the estimates have been revised to 4.4% and 3.6% respectively.
P.S. Japan’s change in its CAPB for 2013 has been revised downward from (-0.3%) to (-0.15%) of potential GDP indicating that the fiscal policy component of Abenomics is even tinier than previously believed. And similarly the estimated degree of fiscal austerity in the UK has been revised upwards.
16. October 2013 at 10:36
Steven Kopits (and Steve),
The UK is also at the zero lower bound, has done even more fiscal austerity than either the US or the eurozone (by cyclically adjusted balance standards), and like the US, and unlike the eurozone, has done QE. But unlike the US, oil production has been declining significantly.
Since 2008Q2 (before QE) NGDP is up by 12.4%, 3.2% and 9.1% in the US, the eurozone and the UK respectively. The variable that best explains this outcome is most certainly not oil production.
It never ceases to amaze me when otherwise seemingly bright people make the completely incoherent claim that real variables are an important determinant of aggregate demand (NGDP) despite the overwhelming empirical evidence to the contrary.
16. October 2013 at 10:46
“It never ceases to amaze me when otherwise seemingly bright people make the completely incoherent claim that real variables are an important determinant of aggregate demand (NGDP) despite the overwhelming empirical evidence to the contrary.”
Mark, I can’t tell if you are being sarcastic or serious because you are being smart and stupid at the same time.
I never claimed that oil supply drove NGDP by itself (please point me to where I said this?) In fact I have consistently supported market monetarism.
However, supply-side factors will drive NGDP conditional on an inflation targeting central bank. (That why I wonder if you are being sarcastic)
On the other hand, if you think adding almost half a Saudi Arabia to the domestic supply side won’t affect real output, well, I can’t help you (That’s why I wonder if you are being stupid)
16. October 2013 at 11:07
Steve,
To be blunt I see absolutely zero evidence of a positive aggregate supply (AS) shock to the US economy.
To see why we have to compare rates of change in NGDP, RGDP and the GDP implicit price deflator over 2009-2013 (or 2010-2013) to what is “normal” for each currency area.
The best way to identify what is normal is to find two years reasonable far apart (say a decade) at similar points in the business cycle (similar output gaps) and compute the average rates of change. Preferably the output gaps should be as close to zero as possible. (I’m using IMF data for consistency and comparability.)
For the US and Japan this is reasonable easy. 1997/2007 works well for the US and 1995/2006 works well for Japan. For the eurozone and the UK it is less so. The eurozone is has only been around since 1999. The best years for comparison are 2000/2008 although the eurozone was nearly 2% above potential GDP in both years. The UK had a long period being above potential in the oughts and below potential in the 1990s. The best pair is 1994/2009 although the UK was nearly 2% below potential GDP in both years.
For the given periods I find that the average rate of growth in NGDP was 5.3%, 3.9%, 0.1% and 4.7% in the US, the eurozone, Japan and the UK respectively. Growth in RGDP averaged 3.0%, 1.8%, 1.1% and 2.5% in the US, the eurozone, Japan and the UK respectively. The rate of change in the GDP implicit price deflator was 2.3%, 2.1%, (-1.0%) and 2.2% in the US, the eurozone, Japan and the UK respectively.
Assuming no change in AS a change in AD should increase or decrease RGDP growth and inflation in the same direction. Moreover, empirically the slope of the AS curve is such that a decline in NGDP growth is usually reflected roughly two thirds in real growth and one third in inflation.
Let’s look at Japan and the UK first. From 2009-2013 NGDP, RGDP and inflation averaged 0.5%, 1.9% and (-1.4%) in Japan respectively and in the UK it averaged 3.0%, 0.9% and 2.1% respectively.
Japan actually had above normal NGDP growth over this period which isn’t surprising since it had both monetary and fiscal policy moving in the same direction (unlike everybody else). But the interesting thing is that the rate of inflation decreased and the rate of real growth increased. That’s a classic indicator of a positive AS shock.
On the other hand the reduction in the rate of NGDP growth in the UK was reflected almost entirely in a reduction in real growth. That indicates a decrease in AS.
From 2009-2013 NGDP, RGDP and inflation averaged 3.8%, 2.1% and 1.7% in the US respectively, and in the eurozone it averaged 1.8%, 0.6% and 1.2% respectively. Thus the reduction in the rate of NGDP growth was reflected in about 60% real growth and 40% inflation in both the US and the eurozone.
So there’s simply no sign of a change in AS in either the US or the eurozone.
16. October 2013 at 11:13
Excellent blogging.
On oil and gas, lots to think about…as the international reserve currency, we can print money and exchange it for oil…Fed has to print enough…
And yet, and yet…why are all of the most successful economies of the last 50 years export-oriented?
Surging oil and gas production and related manufacturing growth…really, it counts for nothing?
I am dedicated to expansive monetary policies and Market Monetarism…but domestic manufacturing seems tied to economic prosperity…think Germany, China…
16. October 2013 at 11:28
Steve, You said;
“Sadly, even supply-siders don’t believe in supply side economics, if it conflicts with anti-carbon ideology.”
I hope this is not aimed at me, as I support fracking.
DanC, I did not reason from a price change, I tried to interpret a price change. Those are completely different concepts.
The average daily movement in stock prices is about 0.8%, and thus you are right that 2% is no big deal. If that’s all the evidence I had you would have had a good point. But of course there is a mountain of other evidence that the debt fight is affecting stock prices, including vastly more significant real time responses to news coming over the wire. Those real time movements in stock prices are highly significant. Perhaps I should have said this but I sort of assumed people understood the market was clearly being impacted by the debt fight.
16. October 2013 at 11:31
Steve, Over the past 5 years the eurozone GDP deflator has grown more slowly than the US deflator. I’m not saying oil played no role in RGDP, but it’s certainly not an excuse for the ECB’s failure to boost NGDP by 3% or 4% per year.
16. October 2013 at 11:44
Scott, my comment was over the top, but my frustation that people don’t look at the numbers stands.
4 million barrels equivalent per day * 365 * $100+ is around $150 billion per year straight to the current account. Consider how much higher the price would be without, consider all the manufacturing industries that have restarted, and it’s pretty much certain that there has been a couple percent GDP positive impact.
Now, there has also been a global spillover effect, due to pricing (or more precisely, extra supply not coming to the US), which means other countries have benefited, too. And lots of noise. So maybe it’s hard to see it in the data. But to pretend it isn’t real, is pretend.
I agree with you on the ECB, and always have.
16. October 2013 at 11:51
Mark,
To do the analysis right, you’d have to estimate a bunch of things: direct supply side effects (1% of GDP), indirect pricing effect (globally zero? but large for the US???), international spillover effects (this helped Europe and Japan, weakening the relative performance difference), and multiplier effects (on industrial supply chains and the service economy).
I’m not claiming to have the right answer, but I’m sure it’s a lot more than 0%, and probably closer to 5%.
16. October 2013 at 12:51
Benjamin,
“And yet, and yet…why are all of the most successful economies of the last 50 years export-oriented?
Surging oil and gas production and related manufacturing growth…really, it counts for nothing?”
All the basic industries (mining/oil, farming/forestry, and manufacturing) create wealth out of thin air. I believe that if monetary policies cause growth in the basics it portends positive growth in the overall economy.
16. October 2013 at 12:54
Steve,
There’s no real need to guess, the BEA provides a fairly detailed breakdown of National Income by industry. Here is the share of National Income by Mining (i.e. Mining, Quarrying, and Oil and Gas Extraction):
http://research.stlouisfed.org/fred2/graph/?graph_id=141978&category_id=0
The most generous estimate I can come up with is that the entire sector has added 0.7% to RGDP between 2009Q3 and 2013Q2 or 0.186% to average annual RGDP growth since 2009Q3. How much of this is due to fracking, and how much simply due to the recovery of energy prices, I’ll leave to you.
But keep this in mind. At 1.75% of National Income in 2013Q2, the entire Mining sector’s share of National Income is still down sharply from its 2.3% peak share in 2008Q3. The only way that those suffering from what I term “fossil fuel derangement syndrome” can come up with their exagerated estimates of the importance of the production of fossil fuels to the national economy is by including value added that does not directly accrue to the actual production of these sources of energy.
16. October 2013 at 13:45
Mark,
You are making lots of errors. For one, dividing the quantity of energy produced by a GDP deflator, and ignoring that the national income share for energy dropped because the price dropped. Natural gas went from $15 to $4 for example. And the products made from energy do matter, too. I realize that this is where the analysis starts to get hairy. But the value of energy is more than just having an oil barrel bonfire in the backyard.
The US CA deficit improved from 5% to 3% or so, almost entirely due to energy, half from backed out imports, and half from lower prices.
If you want to take the analysis seriously (which I doubt), you would tell me what your counterfactual is for a country STARTING with 5%+ CA deficit, that then does $3 trillion in QE, with a lousy supply-side environment.
16. October 2013 at 13:52
I did an analysis a while ago where I researched the countries with the largest oil imports as a percent of GDP. The PIIGS were all in the top 10.
There’s nothing you can do to stimulate your economy if you don’t make any tradables that anyone wants, and you can’t afford your imports any more. Just ask Egypt, which is one of the largest food importers / GDP.
I suspect the Steven Kopits presentation might include this data (but it’s just a guess as I’ve never spoken to him).
16. October 2013 at 15:07
Beckworth:
“What is puzzling to me is how anyone could look at the outcome of this experiment and claim the Fed’s large scale asset programs (LSAPs) are not helpful.”
It is only “puzzling” to he who adheres to a different a priori theory, which in other words is a different theory utilized to interpret the same data.
For example, when I look at that chart, I don’t conclude that the Fed has been “successful” while the ECB has not. The reason I don’t conclude this is that I do not consider it a “success” for an economy to have constant growth in total spending. I consider that to be artificial, unhealthy, and disruptive of economic calculation and coordination.
Neither the Fed nor the ECB is “succeeding” in stopping themselves causing problems to calculation.
Market monetarists seem to all have an intellectual incentive to purposefully ignore it and/or not understand it.
Sumner:
“And this difference largely explains the huge unemployment gap that has opened up between the two regions.”
Employment is a means to an end, not an end in itself. Would you claim that a slave society with 0% unemployment is more “successful” than a free market economy with 5% unemployment? If not, then why should we consider Europe to be less “successful” than the US?
16. October 2013 at 16:55
Mark S.–
We agree on much…but let me pose a question…the financial sector has grown in the last 40 years…capturing a larger fraction of GDP, as recorded…is this “real” growth?
Does it result in higher living standards? Or, is it a somewhat parasitic Mandarin class?
Can we say the same about the oil and gas or manufacturing sectors?
16. October 2013 at 18:51
Steve,
“You are making lots of errors. For one, dividing the quantity of energy produced by a GDP deflator, and ignoring that the national income share for energy dropped because the price dropped. Natural gas went from $15 to $4 for example.”
I’m taking the ratio of two nominal quantities, so this has nothing to do with the GDP implicit price deflator. Even if one adjusts for prices, the fact remains that oil and gas extraction is a subset of an industry that has never contributed more than 2.3% of National Income in recent years.
“And the products made from energy do matter, too. I realize that this is where the analysis starts to get hairy. But the value of energy is more than just having an oil barrel bonfire in the backyard.”
The value is of the product to the rest of the economy is approximately equal to what the product earns. The idea that fossil fuels generate enormous positive externalities unlike every other industry in the economy is one of the main indicators you are suffering from an extreme case of fossil fuel derangement syndrome.
“The US CA deficit improved from 5% to 3% or so, almost entirely due to energy, half from backed out imports, and half from lower prices.”
First of all, it’s clear you’re talking about net exports, not the balance on the current account. The most that the current account deficit reached was 1.6% of GDP in 2005Q4.
Secondly, when looking at the contribution of declining petroleum imports to the improved trade deficit, this depends greatly on the time period of comparison. If one chooses to compare the most recent quarter to the quarter when the trade deficit reached its maximum, namely 2005Q4, then what you will find is that the trade deficit has fallen from 5.83% of GDP to 3.06% of GDP, but petroleum imports have only fallen from 2.31% of GDP to 2.25% of GDP. Thus decreased petroleum imports only account for about 2% of the improvement:
http://research.stlouisfed.org/fred2/graph/?graph_id=142007&category_id=0
“If you want to take the analysis seriously (which I doubt), you would tell me what your counterfactual is for a country STARTING with 5%+ CA deficit, that then does $3 trillion in QE, with a lousy supply-side environment.”
How about the UK?
“I did an analysis a while ago where I researched the countries with the largest oil imports as a percent of GDP. The PIIGS were all in the top 10.”
By my calculations Greece easily has the highest ratio of oil imports to GDP of any of the GIIPS. Belgium, Luxembourg, the Netherlands, Bulgaria, Lithuania, Cyprus, South Korea, Singapore, Thailand and Jordan all have a higher ratio of oil imports to GDP than Greece, so your claim is obviously not true.
16. October 2013 at 19:25
benjamin cole,
“…the financial sector has grown in the last 40 years…capturing a larger fraction of GDP, as recorded…is this “real” growth?
Does it result in higher living standards? Or, is it a somewhat parasitic Mandarin class?
Can we say the same about the oil and gas or manufacturing sectors?”
The financial sector has grown from about 2% of GDP at the end of WW II to 8% of GDP today. Is this a huge drain on our productivity? I doubt it. That’s not to say the financial sector couldn’t use some supply side reforms, but then what sector couldn’t?
Manufacturing has been a declining share of US GDP since about 1950 when it was roughly 32% of output, and Mining, despite all the propaganda, good or bad, has never been more than about 3% of GDP, so I’m not sure what you mean by that last comment.
16. October 2013 at 20:00
“Even if one adjusts for prices, the fact remains that oil and gas extraction is a subset of an industry that has never contributed more than 2.3% of National Income in recent years.”
Mark,
By your logic, if the oil industry bombed half of its well, instantly quadrupling the price, they would have doubled their contribution to GDP. True, in a literal sense, but completely wrong in an economic sense.
16. October 2013 at 20:06
“The idea that fossil fuels generate enormous positive externalities unlike every other industry in the economy is one of the main indicators you are suffering from an extreme case of fossil fuel derangement syndrome.”
My original post said “UN-stranded capital”. My assertion is that global tradables are more valuable than local services.
Imagine an economy where 20% of production is exported, 20% of consumption is imported, and 80% is local services.
Now imagine an asteroid strikes, and manages to destroy the entire export industry buy doesn’t affect anything else.
What happens?
A) The country runs a 20% CA deficit on the kindness of strangers, and consumption is unaffected.
B) The country stops importing, consumption falls 20%, but the service economy is fortunately unaffected.
C) The economy crashes, it turns out the auto mechanic relies on foreign parts, the professor buy gas to commute to school, the hospital needs medical devices for surgery, etc.
I vote for C. You?
I’m not claiming “fossil fuels” are special, I’m claiming global tradables are special.
16. October 2013 at 20:13
“By my calculations Greece easily has the highest ratio of oil imports to GDP of any of the GIIPS. Belgium, Luxembourg, the Netherlands, Bulgaria, Lithuania, Cyprus, South Korea, Singapore, Thailand and Jordan all have a higher ratio of oil imports to GDP than Greece, so your claim is obviously not true”
You need to be careful with countries that resell their oil imports due to large refining, shipping or trading operations. That includes Singapore, Thailand, Belgium, and Netherlands.
Several of the other countries you mentioned (Cyprus, Bulgaria, Jordan) aren’t exactly bastions of economic stability. And Greece, the top oil/GDP importer, is one of the PIIGS and the biggest basket case of all.
The oil data is hard to come by. I had to do a lot of work finding it, and excluding outliers. Did you find an easy data source, or just go with sloppy analysis?
16. October 2013 at 23:35
Steve,
“By your logic, if the oil industry bombed half of its well, instantly quadrupling the price, they would have doubled their contribution to GDP.”
You miss my point. The 2.3% of National Income figure comes from when prices were very high. It was as low as 1.05% in 2009Q3. A multiple of a small quantity is only a slightly less small quantity.
“I vote for C. You?”
I vote for a hypothetical example which bears slight correspondence to the actual contribution of the amount of increased oil production, instead of this all or nothing extreme.
Tradables are roughly one third of US GDP. Thus Mining makes up only about 5% of tradables production in the US.
“You need to be careful with countries that resell their oil imports due to large refining, shipping or trading operations.”
Because Greece has no refining, shipping or trading operations?!?
Yes, the Netherlands’ net imports of oil are less than 40% of its gross imports, but Greece’s net imports of oil are only just over 60% of its gross imports. So although *net* oil imports are indeed a higher percent of GDP in Greece than in the Netherlands, all of the other countries I mentioned have net imports that are more than Greece’s as a percent of GDP. Moreover, by this standard India and Taiwan also spend more on imported oil than Greece.
And yes some of these countries are not notable for their stability. But the point is that there is no clear correlation between the percent of GDP spent on oil imports and economic stability.
17. October 2013 at 01:23
@Mark Sadowski,
I appreciate your soberness of your comments, even when confronted with increasingly histrionic and insulting commentators. Your notes are often as good as Sumner’s posts, and I mean that as a compliment to both.
17. October 2013 at 04:21
Steve, I never claimed it had no effect, I said the effect was far too small to explain the huge gap in the US and eurozone unemployment rate, which opened up after 2011. In addition, I don’t believe in the “multiplier” effects you refer to. The direct effects likely overstate the net impact on GDP.
Remember that the housing crash of January 2006 to April 2008 was equivalent to around 3% of GDP, and yet unemployment rose from 4.7% to 4.9%. That’s the order of magnitude you should be considering.
17. October 2013 at 04:48
Ok, one more time.
Let’s start with an example I *thought* we agreed on: A Greek bailout from Germany.
I thought we agreed that ‘Keynesian’ multipliers would apply if Greece received a $10 billion cash infusion from Germany, no strings attached. Suddenly, the Greek economy expands by $30 billion. Do we agree on that’s possible?
Guess what: from the Greek perspective, this is a positive supply shock! BMWs, electronics, oil, food all roll in at no cost, paid for by someone else. The Greeks don’t care if money came from Germany, or that it is called a “bailout”. The economic stimulus is real, and it multiplies through the economy. Manna from Heaven is the economic equivalent of a positive supply shock.
Suppose instead Greece had an actual supply shock: they discover $10 billion in ‘Unobtainium’ inside the Acropolis. Wouldn’t this have exactly the same effect? Greece sells the Unobtainium, or makes Unobtainable global goods, and the economy grows by, say, $30 billion. Supply shock => multiplier effect
17. October 2013 at 04:57
“The 2.3% of National Income figure comes from when prices were very high. It was as low as 1.05% in 2009Q3. A multiple of a small quantity is only a slightly less small quantity.”
Mark,
The point I made before which you didn’t respond to is that you need to estimate the reduction in the import bill due to the new supply, BOTH from backed out imports and from reduction in price. The correct counterfactual is what would the import bill be will all of the monetary stimulus but none of the new supply. Your analysis is meaningless, as you are making the same mistake I already pointed out twice.
I think you should show some humility in trying to understand the argument before ridiculing it. Otherwise you are just a Paul Krugman wannabe, without the Nobel.
17. October 2013 at 06:39
Ok, I will help you out with the counterfactual you won’t do:
In pre-crash 2008, the US was importing about 5 billion barrels per year. Long term futures price (market expectations!) were as high as $150. This means the expected net import bill was $750 billion. Add $50 billion for natural gas imports. NGDP was around $14.7 billion.
So in 2008 the expect net import bill was 5.4% of GDP.
Today? Imports are 3.5 billion barrels per year, and the long-term price is $80. Expected import bill is $280 billion. NGDP is around $16.6 billion.
So in 2013 the expected net import bill is 1.7% of GDP.
That’s a swing of 3.7% of GDP for net energy imports. And I’m understating it because supply is expected to continue to rise rapidly today, which wasn’t true in 2008.
17. October 2013 at 08:44
Steve,
“Supply shock => multiplier effect”
The New Keynesian fiscal multiplier effect comes from intertemporal substitution in consumption and investment induced by lower expected real interest rates which are the result of increased inflation expectations. I don’t find it to be very believable because it assumes that the central bank will do nothing, and it assumes that the only channel of the monetary transmission mechanism is the traditional interest rate channel.
What model are you using for your even more unbelievable aggregate supply (AS) shock multiplier effect?
“The point I made before which you didn’t respond to is that you need to estimate the reduction in the import bill due to the new supply, BOTH from backed out imports and from reduction in price.”
The only effect is from increased RGDP, which as I have shown can at most be measured in tenths of a percent of total GDP. Everything else is double and triple counting.
“Long term futures price (market expectations!) were as high as $150.”
NYMEX WTI futures settled above $140 on exactly nine days in late June through mid-July 2008. That was a price spike. For 2008 as a whole oil futures averaged just under $100.
“So in 2008 the expect net import bill was 5.4% of GDP.”
Oil futures closely track current prices. The most that the oil import bill ever reached on an annual basis was 3.2% of GDP in 2008. Last year it averaged 2.7% of GDP. The difference is trivial.
18. October 2013 at 08:32
Scott,
My view is that one-off short term crises (probably) don’t affect long term expectations. But if we start to see repeating short-term crises, like the current budget rounds, then we should expect to see markets being effected until the repeating budget issues are finally resolved (which could be medium if not long term).
I think there are probably three factors that feed into the market’s assessment: (i) market attention to/awareness of the risk (if they can’t see it, they can’t price it; if they don’t care about it, they don’t price it); (ii) the probability of the event occurring; and (iii) the magnitude of the event it is does occur.
In a shameful plug/to save excessive length – here’s my post on it : http://bmgoodchild.blogspot.co.uk/2013/10/how-repeating-short-term-crises-can.html
18. October 2013 at 14:53
Mark,
“NYMEX WTI futures settled above $140 on exactly nine days in late June through mid-July 2008. That was a price spike. For 2008 as a whole oil futures averaged just under $100.”
What about rational expectations? The “price spike” roughly coincided with (caused?) a spike in fed funds futures. The point of my counterfactual is that you can’t have it both ways. You can’t have easy money AND low oil prices in 2008.
“The most that the oil import bill ever reached on an annual basis was 3.2% of GDP in 2008.”
Ditto to the above comment. It would have gone to 4 or 5 percent with easy money.
“What model are you using for your even more unbelievable aggregate supply (AS) shock multiplier effect?”
I freely admitted I don’t have a precise model. The problem is that using AS/AD to model a terms of trade shock and conclude that substitute domestic supply is exactly additive to GDP is precisely wrong.
All models are approximately right in their narrow realm, and then fall apart if pushed beyond. That’s why I tried to estimate an easy money/no oil supply counterfactual and compare. And the oil one I used excludes the positive supply shock in natural gas from 2008-2013, which was equally large but diffusely spread through the manufacturing sector.
My guess, 3-6% of GDP, is a WAG. But frankly yours is too, and that’s being kind.
18. October 2013 at 15:14
AD/AS works approximately for macro in a closed economy.
In 2008 and 2009, if we had 5% NGDP, we probably would have had 5% inflation and 0% RGDP for two years. And a much weaker currency, and huge oil import bills. These bills would have needed to be corrected in relatively short order, implying rationing of low value uses of oil, like trips to Vegas, new homes in the exurbs, or inefficient car factories. No amount of market monetarism could have fixed that. But a magic oil supply value would have given an outcome closer to the 2.5% inflation 2.5% growth split we were used to.
18. October 2013 at 15:21
Ultimately the “supply multiplier” value would depend on the micro structure of the economy, rather than on a model.
If the USA had low value uses of energy, like bonfires in the backyard, and these got price rationed away, your 1x multiplier would probably be correct.
If *ALL* uses of energy were mission critical, then my asteroid analogy would be relevant (with only a portion of supply gone).
What actually happened, shutting down autos, housing, and vacations for a while, allowed time for the economy to rebalance. Except that we overshot to the downside due to tight money, and that had additional real costs.
18. October 2013 at 18:02
BM Goodchild, Those are reasonable observations.
19. October 2013 at 11:06
Steve,
“The “price spike” roughly coincided with (caused?) a spike in fed funds futures.”
That is an argument that the oil price futures spike had an effect on the conduct of monetary policy, not that it had an effect on AS.
“The problem is that using AS/AD to model a terms of trade shock and conclude that substitute domestic supply is exactly additive to GDP is precisely wrong.”
As I demonstrated a while back, there’s absolutely no sign of a positive AS shock. That’s not to say that fracking has not had a positive effect on AS, it’s just that the effect is far too tiny to detect. This is consistent with the fact that Mining, Quarrying, and Oil and Gas Extraction are only 1.75% of US GDP, and that the effect on aggregate energy prices has so far been trivial.
“AD/AS works approximately for macro in a closed economy.”
Steve, I could literally bury you with the amount that has been written on the Open Economy AD-AS Model.
“But a magic oil supply value would have given an outcome closer to the 2.5% inflation 2.5% growth split we were used to.”
A pretty good proxy for the size of commodity price shocks on the economy is the Robert Gordon Food-Energy Effect (FEE) which is simply the difference between the rate of change in headline and core PCEPI:
http://research.stlouisfed.org/fred2/graph/?graph_id=135766&category_id=0
The FEE in 2008 was 1.0%, and was the largest positive FEE since the 1.6% FEE in each 1979 and 1980. The (-1.25%) FEE in 2009 was the largest negative FEE since the (-1.27%) in 1986. However both of these shocks are only a fraction of the largest commodity price shocks historically.
“Ultimately the “supply multiplier” value would depend on the micro structure of the economy, rather than on a model.”
The point is that the effects must be measured at the margin, and at the margin the effects are likely to be quite small. More importantly, we don’t really have to guess about these effects, we have a wealth of macroeconomic data that show very little evidence of an effect of the oil shale boom on the macroeconomy.
20. October 2013 at 09:04
“The FEE in 2008 was 1.0%, …The (-1.25%) FEE in 2009 ‘”
Given that there wasn’t a positive supply shock in 2009 (it came later), it would appear this methodology reasons from price rather than supply.
I suspect some of our disagreement may stem from the following: I’m looking at a complete vertical supply curve for oil in the short run. Technically it’s a vertical supply capacity, while OPEC modulates supply subject to available spare capacity.
I’m guessing your papers use a normal sloping supply curve, in which case the supply shock consists merely of a higher required price.
Is that the difference?
20. October 2013 at 09:20
Technically, it’s a normal sloping supply curve that becomes completely vertical at 2008 demand levels.
Shale (and efficiency) represent a rightward shift in this curve.
The hard part is figuring out what this implies about AS (since the vertical oil supply curve is only a small part of AS, but is critically important as a primary good, which could imply a nearly vertical AS curve as well).
Am I getting warmer, or do you still think I’m nuts?
20. October 2013 at 11:44
Steve,
“Given that there wasn’t a positive supply shock in 2009 (it came later), it would appear this methodology reasons from price rather than supply.”
A negative FEE is effectively a positive AS shock since it lowers the costs of production for the economy more generally.
“I suspect some of our disagreement may stem from the following: I’m looking at a complete vertical supply curve for oil in the short run…Technically, it’s a normal sloping supply curve that becomes completely vertical at 2008 demand levels…Shale (and efficiency) represent a rightward shift in this curve. The hard part is figuring out what this implies about AS (since the vertical oil supply curve is only a small part of AS, but is critically important as a primary good, which could imply a nearly vertical AS curve as well).”
The slope of the AS curve only matters in AD shifts:
http://1.bp.blogspot.com/_JqNx8yXnFE8/SxlWoq_PI8I/AAAAAAAABCg/7y9VXIleCrs/s1600-h/Tabarrok-Cowen+ADAS.JPG
Furthermore, I seriously doubt that the slope of the short run AS curve is vertical, otherwise the decline in AD (NGDP) in the recession would have had no effect at all on the rate of RGDP growth.
20. October 2013 at 17:38
“A negative FEE is effectively a positive AS shock since it lowers the costs of production for the economy more generally.”
That doesn’t make any sense. It implies lower AD (which lowers oil prices) is a effectively a positive AS shock, and higher AD (which raises oil prices) is a effectively a negative AS shock for the same reason.
“otherwise the decline in AD (NGDP) in the recession would have had no effect at all on the rate of RGDP growth.”
For oil in mid-2008, the oil supply curve was most certainly vertical. The question is how much does that spill over to AS. I suspect it was steeper than many realize, although certainly not vertical. That’s the point of a real shock, you can’t avoid a recession no matter what, right?
But AD fell so much in late 2008 and 2009 that we moved back into a relatively horizontal AS realm, which was universally harmful. (Hopefully we agree on that!)
My suspicion is that the AS bends from mostly horizontal to mostly vertical faster than people realize, in part because we’ve designed a zero spare capacity global energy system. Maybe I have “fossil fuel derangement” as you say. I just hope I’ve at least conveyed my point of view.
20. October 2013 at 17:53
“A negative FEE is effectively a positive AS shock since it lowers the costs of production for the economy more generally.”
The negative FEE appears to be a positive AS shock, because it moves the economy into the horizontal-ish part of the AS curve.
The positive FEE appears to be a negative AS shock, because it moves the economy into the vertical-ish part of the AS curve.
But FEE has nothing to do with supply, it’s really just reasoning from price, which reflects demand.
Ironically, this is why I’ve supported NGDP targeting all along. It is very harmful to fret about inflation when the AS curve is gentle, and it is harmful to fret about growth when the AS curve is steep, but stable NGDP tends to steer you back towards the bend in AS.
20. October 2013 at 20:11
Steve,
“That doesn’t make any sense. It implies lower AD (which lowers oil prices) is a effectively a positive AS shock, and higher AD (which raises oil prices) is a effectively a negative AS shock for the same reason.”
The price of commodities is determined globally. Because of the sheer size of the US economy shifts in US AD usually have an effect on global commodity prices, and there is in fact a positive correlation between changes in US NGDP and the FEE. But the R-squared over annual data since 1929 is only 18%.
There are many cases of significant increases in the rate of NGDP growth and negative FEE (e.g. 1976, 1983, 1984, 1988, 1992) and significant decreases in the rate of NGDP growth and positive FEE (e.g. 1979, 1980, 1990, 2007, 2008).
“That’s the point of a real shock, you can’t avoid a recession no matter what, right?”
Actually no. Both negative AD and negative AS shocks cause the rate of change in RGDP growth to decrease. Whether there is a recession depends purely on the size of the shock, not the type of the shock. And in fact, in the case of the US, there is only one clearcut case of a recession mostly caused by a negative AS shock since WW II, and that is the 1974-75 recession. That negative AS shock was a result of both an energy price shock and the ending of the Nixon wage and price controls.
“I just hope I’ve at least conveyed my point of view.”
I think I understand your point of view. But I also think I can safely say no macroeconomist thinks the vertical portion of the AS curve shifts in response to an AS shock. An AS shock moves the entire AS curve up or down.
“But FEE has nothing to do with supply, it’s really just reasoning from price, which reflects demand.”
Actually the FEE is the most commonly used supply shock variable in estimates of the Triangle Phillips Curve which is essentially just an AS Curve designed to reflect supply shocks.
The FEE is a relative price change that feeds into the general price level. Changes in the prices of commodities reflect both shifts in supply and demand for commodities. The supply of commodities is irregular and the demand for commodities is inelastic, hence the prices of commodities are volatile.
“It is very harmful to fret about inflation when the AS curve is gentle, and it is harmful to fret about growth when the AS curve is steep, but stable NGDP tends to steer you back towards the bend in AS.”
While the precise shape of the AS curve is a matter of intense debate, in my opinion the “bend” is much larger than you apparently imagine.
20. October 2013 at 20:58
Mark,
Thanks for the civil responses. I think this is starting to become a dead horse, but I’m make one final observation.
You wrote: “there is in fact a positive correlation between changes in US NGDP and the FEE. But the R-squared over annual data since 1929 is only 18%.”
To me this speaks volumes. There have been multiple changes in the market structure for oil (and other commodities) over the last 85 years, so a regression over that much time is useless. Even in 1990-1991 it didn’t matter too much that Iraq invaded Kuwait because spare capacity was high and OPEC was firmly in control. Today is different.
My point is the market structure in recent years has been quite different. And you figure that out (shockingly) by studying the market structure, not by data mining macro data sets. A world where no one maintains spare capacity is very different from 90% of history.
I’ve long thought this was a blind spot in the macro community, and the hostile reaction I received tends to confirm that.
Anyway, I’m argued out, but I’ll check back to see if you want to continue the debate.
21. October 2013 at 09:07
Steve,
“To me this speaks volumes. There have been multiple changes in the market structure for oil (and other commodities) over the last 85 years, so a regression over that much time is useless. Even in 1990-1991 it didn’t matter too much that Iraq invaded Kuwait because spare capacity was high and OPEC was firmly in control. Today is different.”
I discovered a spreadsheet error. It turns out that the R-squared is only 14%.
I can’t speak to the spare capacity issue, but in terms of the impact of US aggregate demand on FEE, the trends are clearly towards a declining importance. In particular US crude oil prices were substantially higher than world crude oil prices until the 1970s. The US market for petroleum didn’t become fully integrated into the global market until 1979.
The R-squared between changes in US NGDP from 1929 through 1970 is 29%. From 1980 through 2012 it is only 1%.
And the US share of world oil consmption has fallen from 27.0% in 1980 to 20.8% in 2012. If it weren’t for the fact that the eurozone, Japan and the UK also fell into recession at the same time as the US, it’s unlikely that the FEE would have been as negative as it was in 2009.
“My point is the market structure in recent years has been quite different. And you figure that out (shockingly) by studying the market structure, not by data mining macro data sets. A world where no one maintains spare capacity is very different from 90% of history…I’ve long thought this was a blind spot in the macro community, and the hostile reaction I received tends to confirm that.”
Macroeconomics is very different from microeconomics. Armchair economists have been lecturing macroeconomists for nearly a century that the key to understanding the macroeconomy is a detailed understanding of their particular subsector of the economy. These people eventually break their teeth sooner or later when their hubris comes face to face with fact that the tail still does not wag the dog.