

Some thoughts on wages and unemployment
Tyler Cowen has a new post that links to some interesting findings. He starts by quoting the NYT:
The share of American adults with jobs is stuck at just 58.7 percent.
The article contained the following graph:
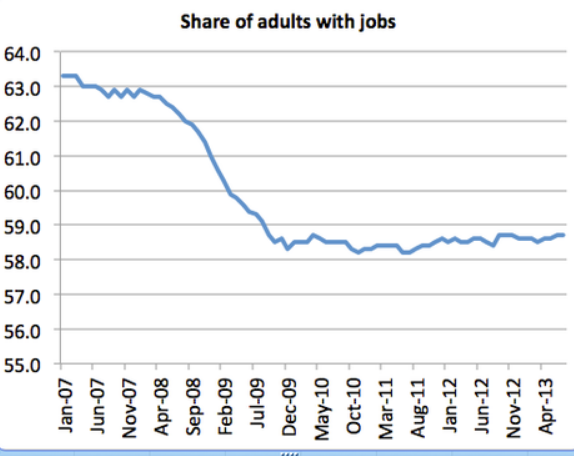
Tyler calls this the “New Normal.”
Let’s talk about what this graph does and does not mean. First, it provides powerful support for Tyler’s “Great Stagnation” hypothesis. Second, it probably is the new normal, although I’d caution that the ratio may rise slightly over the next few years.
And here’s what the ratio does not mean. It doesn’t mean the labor market is not healing. It is. The ratio has been falling for many years, due to factors unrelated to the business cycle. It might help to imagine a gradual downward trend line starting from January 2007 and ending up at around 60% or 61% today. Note that the ratio even fell during the 2007 boom, right along that trend line. Then a huge gap opens up between the trend line and the actual ratio in late 2009, when unemployment was 10%. Then the gap narrows as unemployment falls to 7.4%.
If you reject this analysis then you must explain why during the last 3 decades of the 20th century the ratio trended strongly higher. And if you think the ratio is better than the unemployment rate, does that mean you think there was no recession in 1980, because the ratio was higher at the bottom of the 1980 recession than at the peak of the 1960s boom?
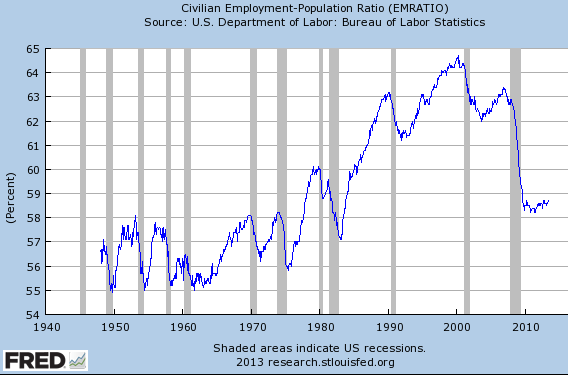
Of course not!
Tyler continues:
One additional development is that long-term unemployment is finally declining somewhat.
He links to a NYT article with this graph:
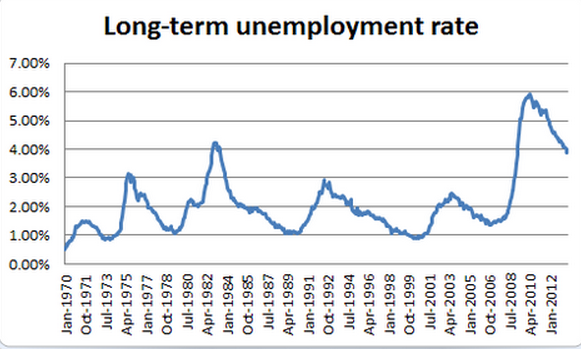
That’s a beautiful demonstration of the effects of 99 week UI and a 40% rise in the minimum wage during a period where NGDP hardly budged. Notice that long-term unemployment in 2009 was far higher than in 1982, even though the overall unemployment rate peaked at 10.8% in 1982 and only 10% in 2008. That’s why although it’s mostly a Paul Krugman recession; it’s also partly a Casey Mulligan recession.
This comment by Tyler puzzled me:
By the way, real average hourly earnings fell in June (pdf), not your grandpa’s economic recovery, is it?
I see several problems with Tyler’s comment, which roughly cancel out. First of all, real hourly earnings did not fall in June. But even if they had (and perhaps he was looking at a different category), one month is not a trend. Real wages have not been falling during the recovery. Nominal wages are rising at 2% per year, and inflation is about the same. More importantly, real wages often did fall during your grandpa’s recovery, at least if your grandpa was about 30 years old in 1921, like mine was. During the steep 1920-21 recession prices plunged sharply during 1920-21, causing real wages to rise sharply. But then nominal wages fell and prices started rising. This reduced real wages and increased employment rapidly.
So Tyler’s right that it’s not your grandpa’s recovery, but that’s because real wages are not falling—they are stickier than in 1921. In your grandpa’s recovery real hourly wages did fall.
PS. The Great Depression recovery is more complex, with real wages plunging much lower during the explosive March to July 1933 recovery, and then rising after the NIRA pushed up wages in the second half of 1933.
Tags:
3. August 2013 at 07:21
This belongs on the previous post, regarding Brad DeLong’s Monetarism paper. Ten years ago–the Golden Age of Econoblogging?–there was a lengthy discussion of that paper;
http://www.j-bradford-delong.net/movable_type/2003_archives/001634.html
Oddly, DeLong himself didn’t join the party. Maybe he was uncomfortable with the allies he found himself among. Anyway, only Monetary Masochists need apply themselves to that discussion.
Those were the good old days.
3. August 2013 at 07:36
Keep in mind that median wages are way down since 2009 and it is not just a single data point. And wages should not still be falling *this late* into a recovery.
3. August 2013 at 08:04
Thanks Patrick.
Tyler, I’d focus on average wages, which are significantly higher than in 2008 in both real and nominal terms. And I don’t agree that wages are still falling, they are rising at two percent per year in nominal terms. In real terms they are flat, but that’s because the recovery is so slow. Median wages pick up the worsening distribution of wage income, so they do less well.
On the other hand, I agree that real wage growth is slowing on a longer term basis, which I do think fits in with your Great Stagnation hypothesis.
3. August 2013 at 08:05
Scott –
The difference between 2000, 1980, and 1960 is women’s entry into the labor market. If you ran this graph just for men, you’d see a slow, steady decline since about 1980 – partly because women are substituting for men in the labor force.
Labor supply is very complex! We should probably be limiting ourselves to ages 25-65 to deal with the baby boom. There’s no easy way to deal with women’s entry. But by any measure, the recent drop in participation is catastrophic.
3. August 2013 at 08:16
SF, I agree, but that in no way affects my argument that we are now on a downward secular trend. It seems to reflect young people staying in college longer, baby boomers retiring, increasing popularity of SSI, etc. Even when we get back to the natural rate of unemployment, the ratio will be far lower than in 2000. It’s not all the cycle! And it’s not (all) a catastrophe. The high unemployment rate is the catastrophe.
3. August 2013 at 08:27
[…] Cowen and Scott Sumner are debating over the significance of the sharp decline in the employment ratio (which looks at […]
3. August 2013 at 08:52
Still, NGDP remains the best explanation (I think) for the state of employment, in particular long term unemployment:
http://thefaintofheart.wordpress.com/2013/04/15/chilling/
3. August 2013 at 10:22
This is the graph that matters. No 2007 decline either.
3. August 2013 at 10:22
Forgot the link http://research.stlouisfed.org/fred2/series/LNU01300060
3. August 2013 at 10:45
“If you reject this analysis then you must explain why during the last 3 decades of the 20th century the ratio trended strongly higher.”
Because one income earner per household is no longer enough, due precisely to economic stagnation.
The workforce has more people who are aged younger, and more people who are aged older, because households need multiple wage earners.
Here’s some advice. Graphs, charts, data sets, in other words, historical data, NEVER prove or disprove economic theories. They can only prove and disprove historical claims, which are of course not economic ones.
3. August 2013 at 12:49
Is there any historical data that breaks down the ratio by age? Over the past decade, more young adults have been going to college which raises their income expectations. In times of recession those who have recently attained a bachelor’s degree will delay their entry into the workforce by continuing their education or moving back in with their parents until conditions improve.
If there hadn’t been a recession, there’s still the troubling issue that even though more young adults are going to college, the percentage of them attaining a bachelor’s degree or better has not significantly increased. What effect does this have on labor participation rates for those in their 20’s under normal employment conditions?
In no way am I saying this explains the trend over the last 6 or 7 years. I’m just wondering if it’s worthy of consideration as a contributing factor.
3. August 2013 at 12:56
Who’s wages are up? The 1% ? Everyone’s? Where is the significant growth? Focusing on average wages won’t tell us who is benefiting most from the “recovery”
Is there a breakdown by income cohorts ?
Just going from my anecdotal observations, I am guessing that most of the gains are concentrated at the top….Like the last 35 years, or worse.
3. August 2013 at 12:58
Geoff says… “Because one income earner per household is no longer enough, due precisely to economic stagnation.”
Good point.
3. August 2013 at 13:01
Employment-population is IMHO the important data point. Clean, with no job-seeking assumptions. E-P is the productive feed-mouths tax base, for goodness sake!
Scott, I imagine that you are mistaking causes and effects:
Young people staying in college longer, baby boomers retiring, increasing popularity of SSI — all symptoms of a rotten job market, not causes for dismissing E-P. I’ll bet that you will see less of the above if the E-P ratio were to improve. It’s simply a less distorted view of labor markets.
Consider please that RGDP is a measly 1.1-1.7%, debt is high, incomes have been crushed to keep profitability high as top-line revenue slows. Companies are not doing capex, and they are not hiring.
Much better than the ad hoc hodgepodge that I see mustered to dismiss E-P.
3. August 2013 at 13:03
Employment-population is IMHO the important data point. Clean, with no job-seeking assumptions. E-P is the productive feed-mouths tax base, for goodness sake!
Scott, I imagine that you are mistaking causes and effects:
Young people staying in college longer, baby boomers retiring, increasing popularity of SSI — all symptoms of a rotten job market, not causes for dismissing E-P. I’ll bet that you will see less of the above if the E-P ratio were to improve. It’s simply a less distorted view of labor markets.
Consider please that RGDP is a measly 1.1-1.7%, debt is high, incomes have been crushed to keep profitability high as top-line revenue slows. Companies are not doing capex, and they are not hiring
Much better than the ad hoc hodgepodge that I see mustered to dismiss E-P.
3. August 2013 at 13:10
Bill Ellis,
Various measures are available e.g. on average unskilled workers’ wages have increased at a rate of about 0.4% per year in real terms over the last 30 years-
http://www.measuringworth.com/growth/growth_resultf.php?begin%5B%5D=1982&end%5B%5D=2012&beginP%5B%5D=&endP%5B%5D=&US%5B%5D=UNSKILLED&US%5B%5D=GDPDEFLATION
3. August 2013 at 13:13
Why has a guaranteed minimum income become a kinda hot topic on econ blogs, but no one ever talks about guaranteed employment ?
It does not seem like one is politically harder than the other…(Both are far out side “Overton’s Window”.) Is there an econ reason ?
3. August 2013 at 13:14
W Penden, Thank you.
3. August 2013 at 13:36
Marcus, I agree.
Wawawa, That shows a secular downward trend since 2000, very clearly.
Gordon, Yes, data exist by age group.
Bill. It tells us what we need to know for business cycle analysis, but not what we need to know for income distribution analysis. One issue at a time.
jknarr, So you think the economy was much closer to full employment at the bottom of the Jimmy Carter recession than the top of the 1960s boom.
Okaaaay . . .
And none of your comments explain the low ratio in 2007.
Bill, Why not do both?
3. August 2013 at 14:40
Labor force participation by ages;
http://www.bls.gov/emp/ep_table_303.htm
3. August 2013 at 14:45
Bill –
“Why has a guaranteed minimum income become a kinda hot topic on econ blogs, but no one ever talks about guaranteed employment ?”
I don’t think guaranteed employment is a good idea. I agree it’s probably politically easier to implement than guaranteed income, because of Puritanical moralism, but I don’t agree that work is inherently better than leisure.
If there’s work than needs to be done, then by all means hire people, but guaranteed employment would become a giant make-work program. I’d much rather give everyone an equal citizen’s dividend (including Warren Buffett!) so there’s no incentive or disincentive to work, and business would be incentivized to economize on labor.
Long term, society should strive to reduce labor and increase output.
3. August 2013 at 15:38
Patrick, thanks for the link!
3. August 2013 at 15:47
I’m inclined to agree with jknarr on this one. From your graph of the E-P ratio, Professor Sumner, I see a trend of falls in E-P being a result of recessions with quick recoveries once the recession ends. The two exceptions are the two latest recoveries, where it seems the penultimate recovery was interrupted by the 2008 recession.
Granted, it does seem like some of the fall is structural but the graph seems to show no sign of it all or even the majority of it being structural.
3. August 2013 at 16:10
Negation of Ideology says…”I don’t agree that work is inherently better than leisure.”
I agree on a certain level…
But, I think most people are constituted to do better when we have a balance of work and leisure. Work makes one feel useful. Without it we feel dependent. Maybe that is just because of convention. Maybe we can create a different morality…But I think not.
I believe that a lot of our behavior is an evolutionary adaptation. And that on a deep level our social evolution is tied to our biology, In other words the propensity to behave in certain ways toward each other in our genes.
So when I observe a type of behavior that is fairly consistent over time and culture That orders society my first position is that biology is playing a roll.
If Biology has a strong role in reciprocity ( A lot of works shows it does ) then I think we need to model society to fill those needs…. In other words people need jobs to feel like they contribute. The need to contribute is very important to us.
3. August 2013 at 16:54
I’m an IT guy which is coloring my thinking of one of the main factors that may explain the downward trend starting about 2000. While the http protocol appeared in the early 1990’s, it took much of the remaining decade before other standards were established around it so that it became capable of being used for things other than information publishing.
With the ability to develop general purpose web applications, companies were able to automate processes that had previously needed people to do rote work. But it did take time to perform that transformation. For example, even though Dell had their website going in the late 90’s to sell computers, the information from the web front end still had to be keyed in by hand into the legacy order system by all the people who had previously manned the telephones.
So an automation revolution started by http may have contributed a great deal to the elimination of rote work and the jobs associated with it. That may cover a good portion of the stagnation starting in 2000. But I’m also concerned that many college students today are being seduced by the message that college education is the solution when they don’t understand that they need to consider supply and demand when choosing their majors. And their mistaken belief that any college education acts as pay fairy dust will contribute to further stagnation.
3. August 2013 at 18:03
Reader, You are misreading the graph. If it was merely cyclical it would rise and fall around a horizontal trend line. But it’s rising and falling around a downward sloping trend line. I don’t see how that’s even debatable.
But I certainly agree that some of the current depressed level is cyclical.
Gordon, If that were the explanation it would show up in faster productivity growth. But productivity growth is slowing.
3. August 2013 at 20:34
I would question you use of the phrase “the boom of 2007.” Housing prices and starts all peaked before 2007. People focus on the “financial crisis” by which they usually mean the Lehman bankruptcy, rather than Bear-Stearns or the events of August 2007, but sectors of the economy had started struggling before and during 2007.
It was only a paper boom.
3. August 2013 at 20:56
I compare government surveys to administrative data and attempt to breakdown mean and median earnings (not wage) changes by cohort, sex, and race, here:
http://www.aeaweb.org/aea/2012conference/program/retrieve.php?pdfid=544
Please note that this is a working paper, which I’m still updating and revising. Comments welcome.
3. August 2013 at 21:14
Scott, I’m surprised to see you hang your hat on the “full employment” chimera. There are bids, there are offers for labor. You’d find retirees plunging back into the labor market if there is enough of a bid. There isn’t, so they don’t.
Households had increased labor participation to compensate for reduced income share since the 1970s. See chart below.
Now US households have neither compensation nor participation. (the lower left hand quadrant). This is called devastation. It’s not trivial, and neither income nor participation appears to be healing much.
http://research.stlouisfed.org/fred2/graph/?g=laH
4. August 2013 at 04:52
Calloftheloon, The labor market was certainly booming in 2007, and that’s all that matters for my claim. You did not have anyone leaving the labor force in 2007 because the job market sucked.
jknarr, You said;
“Scott, I’m surprised to see you hang your hat on the “full employment” chimera. There are bids, there are offers for labor. You’d find retirees plunging back into the labor market if there is enough of a bid. There isn’t, so they don’t.”
It looks to me like you don’t understand what the “full employment chimera” is. Your observation doesn’t conflict with it in any way. The full employment rate is not stable over time–no one claims it is.
In recent years the employment rate for old people has been rising.
And it’s not true that labor market participation increase after 1970 was driven by “need”. The largest increases occurred among affluent families, not poor families. I know many, many professional women who work despite high incomes of their husband. It’s driven by feminism and labor saving appliances and lower birth rates.
America today is a fabulously rich country, the richest in global history outside of a few small oil producers. Poverty has nothing to do with what’s going on in America.
4. August 2013 at 07:17
Scott, yes, I just don’t understand then why carter era full employment is such a critique of E-P. E-P may be more useful than you posit.
The feminism argument may or may not be the prime cause – tough to quantify over time. I am actually inclined to think that it was a cultural symptom of falling real wages. Necessity Is the mother of invention, and cultural rationales follow.
The US has been fabulously wealthy, and still is in aggregate, and is relative to many other countries. It’s just not for the growing majority of the population – the US is falling in economic freedom, median wealth, and others.
(This doesnt have to happen – a parasitic elite is kicking out the economic ladder via tight money, overregulation, and elimination of constitutional liberties. In short, abandoning the formula that created wealth. The US is and was world-historical special. Your political betters are eliminating these special qualitites bit by bit, and you have no say in this outcome.)
5. August 2013 at 10:13
Patrick, fascinating BLS table on labour participation by age and sex. So more older people => lower participation rates, obviously. BUT partly offset by increasing participation rates in those cohorts of older people.
5. August 2013 at 12:19
Scott, while parts of the job market may have been booming in 2007, residential construction employment peaked by mid-2007, stagnated, and began falling by Autumn of that year. Civilian labor force participation rates peaked early in 2007, declined a bit through mid-year, then stagnated until 2009, when they began to plummet. The correlation here is clear and an explanation easily forthcoming: The construction labor market began to fall apart at the same time cyclical housing prices peaked and construction workers started filtering out of the job market, with only just enough job creation elsewhere for some of them to be able to transfer into alternate sectors. When the financial crisis hit, the rest of the national job market caught up with the trend in construction work and, in the following months, labor force participation rates began falling as people left the national job market.
This can be corroborated by general unemployment rates.
I don’t find your exposition here convincing. It seems to me that everything related to labor force participation rates in the last five or six years are perfectly cyclical phenomenon. I don’t see any obvious long trend in declining E-P ratio in the graph you provided — the trough following the 2001 recession was higher than the trough following the early 90’s recession, the peak prior to the ’01 recession was higher than the peak prior to the early 90’s recession, and so on.
All that’s obvious to me is that the recovery from the 2001 recession was weaker than the recovery from the early 90’s recession vis job markets, which is not too surprising when you consider all the talk of a ‘jobless recovery’ that accompanied the early 2000’s.
Data I was looking at comes from
http://www.bls.gov/opub/mlr/2011/04/art4full.pdf (pdf)
http://data.bls.gov/timeseries/LNS11300000
http://data.bls.gov/timeseries/LNS14000000
5. August 2013 at 13:02
jknarr, The vast majority of Americans are still quite affluent. At worst our affluence is not rising as fast as before (I agree with the Great Stagnation hypothesis.)
Michael, I don’t understand your point. Let’s say 2006 was the peak and not 2007. My argument would still stand. We are seeing a secular decline in the LFPR that is on top of any cyclical factors. Even if jobs become plentiful the LFPR will not get back up to 2000 levels. Nobody was outside the labor force in 2006 because jobs were hard to find.
Lots of people seem to think the LFPR can go up for reasons unrelated to the business cycle, or can level, off, but can’t go down for reasons unrelated to the cycle.
5. August 2013 at 17:54
I don’t disagree that it’s possible for LFPR to go down for reasons unrelated to economic cycles, it’s just not obvious from the data I’ve seen that such an idea is applicable in current circumstances.
I was initially just responding to the part of the blog post that highlighted a ‘gradual downward trend starting in January 2007’. LFPR began going downward in 2007 (really, started stagnating — it went up and down around a relatively stable point for a few months until the bottom really fell out on residential construction in the middle of the year), yes, but this is perfectly consistent with a cyclical interpretation of LFPR trends.
Also, the over all point of that paragraph (that LFPR being still low doesn’t mean the labor market isn’t recovering) is true, but a cyclical interpretation of LFPR trends implies that there is a lot more healing we need to work through than just looking at the U3 would hint.
6. August 2013 at 07:54
Scott, I clearly put more fault on the activity-dampening supply-side policies of government (forcing people to ask for permission to do anything and everything, in triplicate, or go to jail) – mostly since the 1970s – alongside their activity-dampening demand side policies (tight fed, low NGDP – since 1982 or so) — than I do any big stagnation.
If liberalizing commerce and raising NGDP failed to work, then we may could be structurally stagnating. Until then, we are experiencing a pure garden-style economic mismanagement – obscured, of course, by theories of some mysterious permanent economic shift.
I like the investigation of the GS, but nobody knows the significance of technological development in advance – the real question is whether there is the surplus demand to adopt and expand the network of technological applications.
The reason why you have jet travel is the ongoing number of people willing and able to use the technology and the accompanying travel system when you are not – not that someone invented the jet engine per se. Technological availability is almost purely a demand function, and so tight money has repressed innovation, qed.
6. August 2013 at 13:53
Michael, I should have described the downward trend as starting in 2000, not 2007.
jknarr, Those structural problems imposed by the government are very much a part of the Great Stagnation.