

Real aggregate demand?
As I’ve pointed out in numerous previous posts, there is no more nonsensical concept in all of macroeconomics than “real aggregate demand”. What does that even mean? Aggregate demand is a nominal concept.
David Beckworth directed me to a tweet from the Roosevelt Institute:
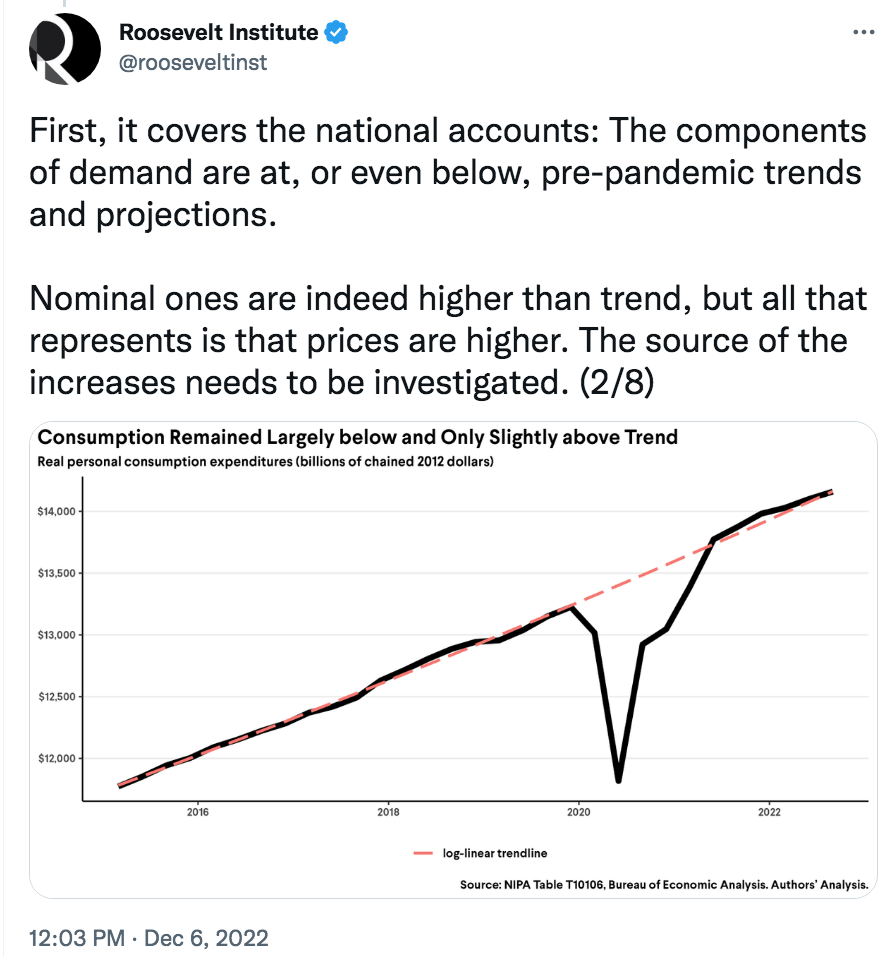
Oh, just higher prices? Is that all? By that criterion, back in 2008 “demand” was below trend in Zimbabwe. Real spending was declining even as nominal spending was rising by billions of percent per year.
Macroeconomics is truly in a new dark age.
PS. If you still don’t see the point, just draw an AS/AD diagram and start shifting the lines. Look at P, Y and nominal GDP. This is Macro 101.
Tags:
9. December 2022 at 10:46
I thought ‘real’ just meant *nominal, but corrected for inflation (according to some measure of the latter)*. If so, every nominal quantity has a real counterpart.
9. December 2022 at 12:43
2021-01-01 11.7
2021-04-01 13.8
2021-07-01 9.0
2021-10-01 14.3
2022-01-01 6.6
2022-04-01 8.5
2022-07-01 7.3
N-gDp still too high.
But the deflator looks too low:
2021-01-01 5.1
2021-04-01 6.4
2021-07-01 6.2
2021-10-01 6.8
2022-01-01 8.4
2022-04-01 9.1
2022-07-01 4.3 ?
9. December 2022 at 16:30
@Philo: you can certainly take some calculated inflation rate, and discount nominal GDP in some year by the inflation rate. And that results in some number. But what does that number mean? What is it that you have then calculated? Of course what you have then calculated is “real GDP”, but in what sense does the word “demand” apply to that concept?
We know what “real GDP” means: it is the production of actual goods and services. We know what aggregate demand means: it is the nominal money used to purchase final goods in transactions. What does “real demand” mean? What economic concept are you attaching to that number you calculated?
9. December 2022 at 22:30
Philo, Don gives a good explanation.
9. December 2022 at 22:56
Perhaps nominal GDP is a more useful quantity than is real GDP, but I do not see that the latter should be utterly dismissed. When comparing GDP year to year, to get an idea of the rate at which the value of national production is increasing, it seems perfectly reasonable to impose a deflator—in other words, to work with real GDP rather than nominal.
10. December 2022 at 05:16
As someone who knows less than he wishes he did ——-here is what confuses people like Philo and me.
Clearly, aggregate demand is what is spent—-nominal GDP—-money spent. But I too do not understand why Real GDP is not also demand——or at least could be. I cannot tell if this is not true according to “definitions”, or inherent meaning (i.e. real demand as a non-sequitur)
Why couldn’t demand be viewed as something like the following. Me, the final spender, decides this year he wants a new Mazda CX-9, 10 new Amazon essential shirts, upgraded Wi-Fi , an Apple Watch, better air conditioners, and 2 trips to St. Barths. I want these things and it costs what is costs.
And so on. What pops out is NGDP. But so does RGDP.
So, the question is——what is meant by aggregate demand? Is it by definition a term that means nominal demand? And it’s just how we analyze macro? As mentioned above ——why is real demand a non-sequitur? Did it have to be?
10. December 2022 at 06:04
At times, simple obstacles stop me in my tracks. With Philo and Michael Rulle, and with thanks to Scott and Don Geddes . . .
In the AD/AS model, RGDP is the label on the x-axis. So how can RGDP not be part of AD?
Can we view Scott’s point analogously to demand and supply? Quantity is the horizontal axis, price the vertical axis. Demand consists of pairs of prices and quantities demanded; supply, of quantities supplied. Equilibrium occurs at the price for which quantity demanded equals quantity supplied.
Compare RGDP (output) on horizontal axis, PL (price level) vertical axis and equilibrium of aggregate demand and aggregate supply at a specific price level and output quantity.
Equilibrium occurs at an intersection of AD and AS. Each is represented as functions of PL and RGDP.
So, RGDP seems to me essential to the concepts of aggregate demand and nominal GDP.
As I recall, I learned the formulation of the “equation of exchange” MV=PQ rather than MV=PY. It still seems more intuitive to me—Q is the stuff (goods), P the price of the stuff.
I think of quantity demanded as an essential component of a demand curve; why wouldn’t RGDP similarly be considered as a component of aggregate demand?
Coincidentally, I’ve just been rereading Money Illusion, the book. Yesterday I pondered the Fisher equation and, on page 72: “change in nominal variable” = change in real variable + inflation”. I may be confused, but I’m still trying.
10. December 2022 at 06:19
Philo, You said:
“When comparing GDP year to year, to get an idea of the rate at which the value of national production is increasing, it seems perfectly reasonable to impose a deflator—in other words, to work with real GDP rather than nominal.”
But that’s not what they are doing. They are using a real variable (actually consumption) as a measure of demand, not as a measure of output. They are claiming that the graph shows that inflation is not caused by excess demand. Huh?
Yes, real GDP is a perfectly fine measure of output, of quantity supplied.
John, Draw a AS/AD diagram. Assume demand does not change. Shift AS to the right. What happens to real GDP? In EC101 we teach students not to mix up demand and quantity demanded.
10. December 2022 at 06:44
No offense to some of the commenters here, but I think it would be useful if you read an Econ 101 textbook. Maybe check out chapter 3 of this one:
https://open.lib.umn.edu/principleseconomics/open/download?type=pdf#page81
10. December 2022 at 08:39
Scott,
Thanks for your reply. I appreciate your explanations as among the most consistently coherent.
Answering: an increase in AS would show equilibrium output (RGDP) increasing and the equilibrium price level decreasing.
The graph as posted doesn’t make sense to me. Perhaps there’s just something I don’t see that you and David do. I tried to compose a longer comment, but couldn’t make it clear enough.
I don’t think my issue is with an understanding of demand and supply, as Garrett seems to suggest.
Back to the graph: “components of demand [C,I,G,Ex,Im] are at or even below pre-pandemic trends and projections.” Perhaps there’s a loose (to me understandably) use of terms demand and components of demand, mixing (as is typical of Econ 101 students) demand and quantity demanded and/or supply and quantity supplied.
Thanks again.
10. December 2022 at 08:48
@Garrett
That book is wrong, pg. 747. Friedman bastardized the concept on his car tag. It’s Irving Fishers’ transaction concept that is right.
AD = M*Vt where N-gDp is both a proxy and subset. Contrary to Blinder, oil’s decline is determined by monetary flows, the volume and velocity of money (not supply shocks):
01/1/2022 ,,,,, 1.998
02/1/2022 ,,,,, 2.011
03/1/2022 ,,,,, 1.633
04/1/2022 ,,,,, 1.382
05/1/2022 ,,,,, 1.320
06/1/2022 ,,,,, 1.231
07/1/2022 ,,,,, 1.195
08/1/2022 ,,,,, 1.280
09/1/2022 ,,,,, 1.143
10/1/2022 ,,,,, 1.094
11/1/2022 ,,,,, 0.851
12/1/2022 ,,,,, 0.549
10. December 2022 at 12:09
John, Another way of looking at S&D is that the equilibrium quantity represents both quantity demanded and quantity supplied. So when that equilibrium quantity changes, that change provides absolutely no information as to whether the initial cause was a shift in the supply curve or the demand curve.
Alternatively, if NGDP is rising at 9% during a period when unemployment is only 3.5%, then you are almost certainly going to have a major inflation problem unless productivity growth were miraculously high.
10. December 2022 at 14:30
Scott,
You replied to John with:
“Alternatively, if NGDP is rising at 9% during a period when unemployment is only 3.5%, then you are almost certainly going to have a major inflation problem unless productivity growth were miraculously high.”
Probably better to say that if NGDP is above the long-term trend when there’s substantial evidence of a labor shortage, there MAY be a longer-run inflation problem. However, how much above the long-term trend matters, if the SRAS/AD model is taken both seriously and literally. Afterall, if there is a negative supply shock and the economy did not fully recover from the last downturn, it is possible that NGDP needs to rise above the long-term trend for real GDP to get to potential.
10. December 2022 at 14:33
I should add that I think it’s a mistake to look at current inflation figures, rather than expected inflation. If one is level targeting NGDP, look at future expected NGDP.
10. December 2022 at 15:01
Scott,
Pre-Scott, I was aware that a change in equilibrium price or quantity did not explain cause, though I could be sloppy. After your many reminders, I’m less likely to forget. “Never reason from a price change” isn’t literally a mantra for me, but it can’t be chanted too often.
With your latest comment and the AP Macro AD/AS model I teach, I can think of SRAS as inelastic and your observation makes sense. AD increases (measured as NGDP, PY or PQ), output changes are constrained (might have been significant during the Covid dip, but no longer), so inflation must increase.
Tyler and Alex use a different model in their 101 textbook (for me, Macro is 102), with changes in prices (aka inflation) and changes in RGDP. Add the changes to get spending growth (change in NGDP). Helpful to look at changes. I should try to think that way more often.
Your actual numbers showing fast-growing NGDP and full-employment unemployment are helpful.
Thanks for continuing.
PS. And thanks, Michael.
11. December 2022 at 09:14
The economy can be at different levels (higher and lower) of equilibrium, and N-gDp composition (R-gDp and inflation).
11. December 2022 at 09:53
SS: “As I’ve pointed out in numerous previous posts, there is no more nonsensical concept in all of macroeconomics than “real aggregate demand”. ” – as Philo says, it’s just nominal Y/GDP/Demand (they are used interchangeably, this is Econ 101) deflated by inflation. It’s not rocket science.
Note to class: nobody understand Sumner. Professional economists, students, even the data itself. Only Sumner understands himself (though his frequent cites to Karl Ove Knausgård shows he has doubts about himself?).
Note to class 2: it’s characteristic of Austrian economics to say there’s no such thing as AD. I got booted from the Mieses Institute site in Alabama for trying to make sense of this, in a very civil way. It rubbed the moderator wrong. I was not even one-tenth as provocative as I am on his site, which, to the credit or detriment of our host, I’ve not yet been banned from.
11. December 2022 at 10:19
Ray, That’s quantity demanded, not demand.
11. December 2022 at 19:15
Is this what the Post Keynesians used to call ‘effective demand’? I never thought that made much sense, but it’s a ‘Thing’.
11. December 2022 at 21:41
Most economists, in fact, are not as pessimistic as the former Fed chairman. According to CNBC’s Steve Liesman, a survey conducted in January of 50 economists had put the odds of a recession at 25%, not 33% as Greenspan predicted.
Others believe investors should pay more attention to Bernanke than Greenspan anyway.
″(Bernanke’s) actually got his finger on the button now, not Alan Greenspan,” Lehman Brothers Senior Economist Drew Matus said on CNBC’s “Squawk Box.” “So if you want to figure out who to listen to, I would listen to all those Fed officials who keep telling us that they are worried about inflation.”
https://www.cnbc.com/2007/03/06/greenspan-sparks-more-debate-with-latest-recession-prediction.html
11. December 2022 at 23:51
You say that “real GDP is a perfectly fine measure of output, of quantity supplied.” But quantity supplied = quantity demanded. Why favor the term ‘supplied’ over the term ‘demanded’?
The chart you reproduce shows “real *personal consumption* expenditures,” not expenditures on all goods and services; but I suppose a chart of the latter would look very similar. The point of the chart seems to be that the economy has recovered from the COVID downturn. That seems correct, while being quite irrelevant to the question whether inflation (or the rate of growth of NGDP) is too high; does the Roosevelt Institute say otherwise?
{Does your point concern the distinction between *amount demanded* and *demand schedule*? *Amount demanded* has to be real. Are you saying that *demand schedule* has to be nominal? I don’t see that, since I think any nominal concept has a real counterpart. In comparing the national demand schedule for some good in year n with that in year n + m, where there has been inflation in the intervening m years, you probably want to correct for inflation–i.e., you are probably interested in comparing real demand schedules.}
12. December 2022 at 09:21
Scott,
I hope you’ll forgive another comment from me on this thread. By chance, Macro Musings features an interview with Joseph Gagnon that focuses on a point I made in my blog post last night. It’s also one that, as you know I’ve been making for years now. That is, that most economists have not seemed to take the SRAS/SRAD model literally or seriously, with serious real consequences.
12. December 2022 at 09:43
Pyrmonter, Given what I know about Post-Keynesians, it wouldn’t surprise me if they made the same mistake.
Nicolas, I don’t think the risk of recession was all that high in March 2007.
Philo, It makes no difference whether you say quantity supplied or quantity demand. The point is that this doesn’t measure “demand” in the sense that macroeconomists define the term, i.e., aggregate demand.
Thus it makes no sense to say “we don’t have a demand problem because quantity demand is only back to trend.” That tells us nothing about demand. It mixes up demand and quantity demanded.
Sure, you can create a concept called “real quantity demanded” but it has no bearing on demand as the concept has been defined ever since the days of John Maynard Keynes.
12. December 2022 at 10:35
Michael, I agree with Gagnon that NGDP level targeting is best, but I don’t think 4% or 5% makes much difference. We had 3.5% unemployment in 2019 with 4% NGDP growth, and now we have it with 9% NGDP growth. You can’t get blood from a stone.
The best way to get low unemployment is to have stable NGDP growth, not high NGDP growth.
I don’t find the Phillips Curve to be a useful tool for thinking about monetary policy; it does not provide useful guidance.
12. December 2022 at 11:11
Scott,
You presumably have forgotten more about the SRAS/AD model than I’ll ever know, and likely taught it to undergraduates for many years. Do you take that model literally and seriously?
If so, do you agree that after a negative nominal shock under a flat inflation targeting, such as the Fed used prior to 2020, that it will impose a delay on return to equilibrium, even apart from the lack of level targeting?
I agree with you that NGDP level targeting is necessary to get close to optimal policy, but think the target needs to be higher than you do given the above issue. Yes, in the long run, money is still neutral, but it’s much longer run than most economists acknowledge.
You seem fixated on 3.5% unemployment being close to the natural rate, but how do you actually defend that claim? And of course, today the natural rate could be higher due to Covid and other supply-side factors. It could go back down to some degree in the near future as the supply side “heals”.
13. December 2022 at 10:21
And when you’re practicing a psuedoscience all you have to do is change the definition — change the parameters and change the goalpost.
https://mises.org/wire/no-surprise-wall-street-wants-raise-target-inflation-rate-above-2-percent
Sumner’s band of marauders are back; this time they want to change 2% to 6%. Think you have less purchasing power? That’s your fault. Because we’re not in a recession folks. Recession is whatever we want it to be. And there is no inflation if we increase the target.
Always remember to “recalibrate your mind” because we need to adopt the “new normal”
13. December 2022 at 20:34
The fed funds rate has been raised YET AGAIN to 4.25 percentage points
1. What’s it going to take, Scott? For NGDP and inflation to fall to trend?
2. Are these small steps the wrong way to go? Should the fed put the pedal to the metal, rip off the band aid and channel Volcker and get a short sharp recession- a v shaped one? (And then presumably they can ease up once inflation and NGDP hits trend again?)
3. The miniaturist 50 basis points here or their approach seems to be dragging this out endlessly. You should hear my mother curse the Fed each time the Fed raises rates, and the stock market falls! 😂🙄😏
4. I don’t necessarily have faith that the Fed can engineer a soft landing
🛬.
14. December 2022 at 08:43
Michael, If you take the SRAS/AD model seriously, you know that in that model raising the trend rate of NGDP growth doesn’t help. So I’m not sure what point you are making.
I don’t know the precise natural rate of unemployment, and I don’t really care what it is. Also, it changes over time.
15. December 2022 at 05:20
Scott,
I’m making the same point I’ve been making for years, which is the point Gagnon is now making. That is that the SRAS is very flat and gradually slopes up as AD increases toward the LRAS curve. As it does so, both RGDP growth and inflation increase.
Hence, if you set your NGDP target using the average NGDP growth rate during a relatively depressed period of growth, you will unncecessarily drag out the return to RGDP potential and full employment.
Even worse is applying a flat inflation target, as the Fed did for so long, which increasingly chokes off accelerating growth at the end of recoveries.
15. December 2022 at 11:40
I’ve been thinking about this for a day or two, and tried a banana hypothetical, e.g.:
In an economy that only consumes bananas:
1) In year zero, bananas cost $1 each and people eat one million of them. Total banana consumption is $1M
2) In year one, bananas cost $1.50 and people eat one million of them. Nominal banana consumption is $1.5M has increased by 50%, but inflation-adjusted or “real” banana consumption is flat.
In the tweet threat Scott quotes, The Roosevelt Institute is attempting to demonstrate that inflation is the result of supply shocks and not increased demand. They do so in part with the quoted tweet, which shows that when adjusted for inflation, aggregate consumption remains near trend.
I’m no expert, but I think the Roosevelt Institute has two problems.
1) They use a chart of aggregate consumption, but call it “aggregate demand.”
2) For some reason, they think on-trend aggregate consumption is more consistent with a supply shock than with an increase in demand, which seems to be reasoning from the absence of a price change. Without more information, my first assumption would be that an increase in the money supply caused more dollars to be chasing the same amount of stuff, but for better or worse, my first assumption is always that inflation is a monetary function.
15. December 2022 at 15:30
Large CDs signal a recession
Large Time Deposits, All Commercial Banks (LTDACBM027NBOG) | FRED | St. Louis Fed (stlouisfed.org)
Economists just don’t get it. Banks don’t loan deposits. An increase in bank-held savings destroys the velocity of circulation. So, we get FOMC schizophrenia: Do I stop because inflation is too high? Or do I go because R-gDp is falling?
All monetary savings, bank-held savings, originate within the commercial banking system. Demand deposits are just shifted into time deposits.
Since time deposits (income held beyond the income period in which received), a component of M2, originate within the banking system (and there is a one-to-one relationship between time and demand deposits — an increase in TDs depletes DDs by an equivalent amount), there cannot be an “inflow” of time/savings deposits and the growth of time/savings deposits cannot, per se, increase the size of the banking system.
From a system standpoint, TDs constitute an alteration of bank liabilities, their growth does not per se add to the “footings” of the consolidated balance sheet for the system.
16. December 2022 at 08:39
Michael, We’ve been over this 100 times.
J Mann, Yes, but no need to make this complicated. EC101 says quantity is not indicative of demand. Period. End of story.
16. December 2022 at 10:00
Scott,
Yes, I’m sick of going over it in this forum myself, but I can tell you there are prominent readers who contact me directly who don’t think you’ve ever addressed this point to their satisfaction.
Maybe we’re too blame for being dense, or maybe there’s a communication problem, or some combination.
It’s probably best at this point to agree to disagree.
18. December 2022 at 06:01
Michael, I recall in 2019 people were saying that if we only had more demand stimulus, we might be able to drive unemployment below 3.5%. In 2022, we applied an almost absurd amount of extra demand stimulus, just as they’d asked for in 2019, and unemployment never fell below 3.5%. Instead we had worker shortages. What does that tell you?
18. December 2022 at 09:40
Scott,
2022 doesn’t tell me much about 2019, because the pandemic has likely increased NAIRU, at least temporarily.
You have a good point that all the Fed did in late 2018/early 2019 is bring NGDP growth back down to the long-term trend. On the other hand, they pushed both core inflation and expected core inflation well-below their 2% target, and began lowering interest rates, in what might be seen as a policy reversal.
My argument is that I don’t think that NGDP trend that you site is a sufficient baseline upon which to judge monetary policy. Otherwise, I would agree with you. I think unemployment could have and should have gone sustainably lower in 2018 and 2019. This would have required a period of above 2% core PCE inflation, but with inflation expectations remaining close to target.
18. December 2022 at 09:48
Scott,
Also, again, stock prices rebounded more than 29% after the Fed started lowering interest rates in 2019, after roughly 20% plunge in late 2018 during the tightening cycle. This strikes me as primarily a response to Fed-related higher NGDP growth expectations, rather than a sudden increase in pricing power of publicly traded firms, or lower long-ter, real rates.
19. December 2022 at 12:40
Michael, You said:
“2022 doesn’t tell me much about 2019, because the pandemic has likely increased NAIRU, at least temporarily.”
The same dismissal of evidence could be said about everything you say. We don’t have proof of anything in macro, I go with the best evidence we have, which favor slow and steady NGDP growth, with level targeting.
20. December 2022 at 17:02
Scott,
There is much truth to your last point, but the reaction of stocks in 2019 strongly suggest a positive nominal shock associated with the Fed lowering rates, yet with well-below 2% core PCE inflation and expected inflation. Some of the 29% gain in the S&P 500 in 2019 was expected, but obviously most of it was not. Afterall, it followed a decline of around 20% in late 2018, which was associated with the Fed raising rates during the trade wars.
Mean YOY NGDP growth in 2018 was 5.42%, while it was 4.13% in 2019. That’s a difference of roughly 24%, while again, the S&P 500 fell nearly 20% in 2018. Some of the 29% S&P 500 gain in 2019 was expected, leaving probably 25% or 26% of that gain as the result of the nominal shock.
Again, with well-below core PCE inflation and inflation expectations, that suggests the nominal shock had overwhelmingly real effects.
20. December 2022 at 17:10
I should probably restate that I don’t think low real rates boost stock prices. My model says that changes in the S&P 500 reflect changes in the expected mean NGDP growth path. Hence, when NGDP growth is low during a downturn, stock prices are more volatile and are boosted in proportion to the recovery in the mean expected NGDP growth path.