

NOW do you see what I was talking about
Suppose you woke up and read this while drinking your morning coffee:
LONDON (Reuters) – At attempted rebound in European stocks quickly fizzled out on Monday after markets around the world and oil prices slumped to multi-year lows amid persistent worries over an inflationary global boom.
Unless you were a central banker, you probably would have spit out your coffee. Surely that must be a typo! Calm down, I changed the last three words from today’s news.
For years I’ve been arguing that slow NGDP growth reflected excessively tight money. People were skeptical. “The Fed’s out of ammo, there’s nothing they can do.” The funny thing is that this myth has become so deeply engrained that the media continues with it, even after we are no longer at the zero bound. The title of the actual article is:
Europe struggles to lift global gloom
Struggles? Um, didn’t the ECB disappoint markets at their last meeting by not cutting the policy rate (as markets had expected)? How is it a “struggle”, if you aren’t even trying?
Meanwhile in the US, the Fed “struggles” to boost our economy by raising the target rate. Seriously, the Fed actually believes the almighty dollar, the ultra strong dollar that is contributing to a global commodity price crash, is still too weak, too feeble, and needs to be even stronger. That’s because of a Phillips Curve theory that was completely discredited by Friedman and Phelps in the 1960s, but the Fed still holds on to, convinced that low unemployment causes higher inflation. Take a look at the graph below:
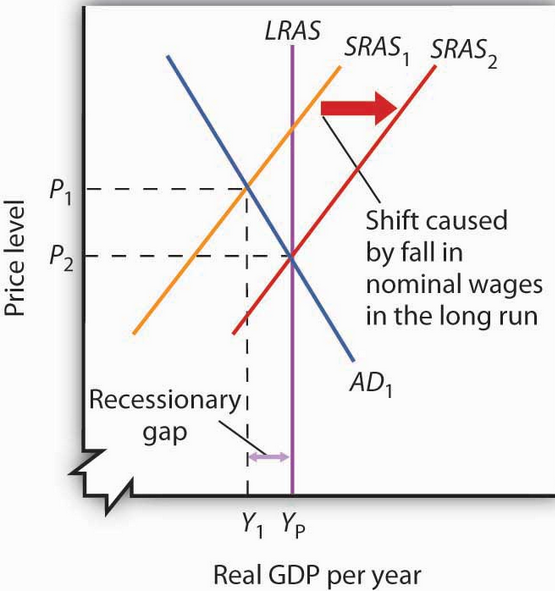
This is the textbook AS/AD model, showing the recovery from a demand-side recession. It probably makes more sense to view the vertical axis as the inflation rate, rather than the price level. Do you notice that inflation falls during both the recession and the recovery? That’s standard AS/AD. The Phillips curve, in contrast, is just an AD model, and hence only 1/2 as good as the AS/AD model. The Phillips curve model says falling unemployment is inflationary, whereas the AS/AD model says when unemployment falls during a recovery (due to wage moderation) it is disinflationary. Which one better fits the facts?
Now the Phillips Curve proponent might counter, “Yes, but once unemployment falls below the natural rate, inflation will rise.” Only if it is pushed below by an increase in AD, i.e. faster NGDP growth. But the bond market is telling is that NGDP growth will not increase. The Fed predicted its December tightening would raise bond yields this year, whereas it’s actually reducing them.
In the standard AS/AD model, once you return to the natural rate, inflation will stay at the new lower level. In the 1980s inflation stayed lower, it did not rise back to the level of the 1970s. In the 1990s inflation stayed lower, it did not rise to even the quite modest levels of the 1980s. There’s utterly nothing in the AS/AD model that tells us inflation will rise when unemployment gets back to the natural rate. But the Fed is assuming there is.
For years I’ve been saying the central banks could do more, but simply refuse to. NOW do you see what I was talking about? Everyone can now see that central banks don’t see anything “funny” about the joke at the top of this post. Only the markets get the joke. The central banks simply aren’t trying. Demand shortfall? What demand shortfall?
Here’s a more interesting joke. In December, some pundits said there was an argument that higher rates would reduce the risk of bubbles. OK, mortgage rates are now falling. Does that mean we need still higher rates? When will these higher fed funds rates bring us the higher mortgage rates that will prevent the bubbles?
(I should say, “supposedly will prevent bubbles”, as actual so-called bubbles tend to occur when rates are high, such as 1929, 2000, and 2006, not when rates are low (1932, 2002, 2009).
Tags:
18. January 2016 at 09:21
Higher mortgage rates, coupled with adjustable loans, created the housing bubble of the last decade. How can you make money as a bank on adjustables if the rate at the end of the adjustable period is really low? You have to have the loan adjust to a much higher rate than the initial rate, in order to make money if you are a bank.
18. January 2016 at 11:01
Scott,
Let’s start by assuming that prices are fixed in the current period and flexible in the next period. If the Central Bank (who also happens to directly control NGDP in this thought experiment) causes NGDP to fall, then real GDP will initially fall as prices are currently stuck. In the next period, the price level will fall to it’s new market clearing level.
Now suppose that prices are not completely stuck in this period and instead are simply sticky. A reduction in NGDP will result in both a lower price level and lower real GDP. Here, we have a Phillips Curve. In the following periods the price is still sticky, so the price level continues to fall slowly as real GDP returns to equilibrium. This seems to be a bit tricky for basic Phillips Curve logic; after all, how could output be growing while there is deflation is the Phillips Curve exists?
Let’s switch to thinking about the output gap instead of output levels. The initial contraction causes the output gap to become negative, which is consistent with some deflation. As the output gap improves, there is still deflation, but this is because there is still an output gap. In this simple model, inflation is proportional to the output gap. If output is above LRAS, firms slowly set higher prices in order to return to equilibrium and vice versa. The Phillips Curve lives!
Let’s say that firms are also forward looking; they maximize the discount sum of all future profits instead of just current profit. In this case, firms will take into account expectations of future output gaps when making current period pricing decisions. It looks like we now have the NKPC, which serves to (at least seemingly) explain how we had the Great Moderation.
18. January 2016 at 11:23
I may be making a basic economic mistake in my thinking (disclaimer: I’m a scientist, not an economist; yes that was a subtle jab at economists, I apologize); but why would declining unemployment be inherently disinflationary?
If unemployed people have a higher marginal propensity to consume than employed people (as I expect they do), then the increase in consumption/demand caused by putting unemployed people to work would not be completely cancelled out by the decline in consumption due to the fall in wages for the employed, so there should be a net increase in demand, and therefore an increase in prices, right? Which wouldn’t make lower unemployment disinflationary, if I understand correctly.
Of course I’m ignoring the increase in supply. But I guess I’m not sure I should take for granted that supply will increase by enough to meet the demand increase caused by the shift in income toward people with a higher MPC? Perhaps for the demand increase to exceed the supply increase, MPC would have to decline unrealistically as one goes from unemployed to whatever the new wage is. In theory though, with a high enough downward sloping MPC curve, it should be possible, if not realistically probable, for demand to outpace supply as as unemployment falls, right?
18. January 2016 at 11:48
That’s some serious institutional failure on the part of the world’s central banks. Maybe they need some new mandates, although given that they haven’t even been able to bring themselves to hit their own targets for inflation and so forth I’m not optimistic.
I’m getting a “false consciousness of the banking governors” vibe here. They’ve decided in advance that “loose money” is bad, and now they’re grabbing on to any straw to justify policies curtailing it.
As for the Phillips Curve, I think it’s because it’s so intuitive even if it’s wrong. It seems like once you get to full employment and are now at the point where jobs are outstripping workers, wages are rising as employers raise them to draw workers away from other employers, etc inflation would have to rise.
18. January 2016 at 11:55
I agree that central banks refuse to do more, but they don’t want to. Did you read this crazy Bernanke interview before and this Zero Hedge article? http://www.zerohedge.com/news/2015-10-23/bernanke-says-economy-needs-crash-periodically-so-we-can-be-sure-were-pushing-it-har
Bernanke said this:
“My mentor, Dale Jorgenson [of Harvard], used to say — and Larry Summers used to say this, too — that, ‘If you never miss a plane, you’re spending too much time in airports.’ If you absolutely rule out any possibility of any kind of financial crisis, then probably you’re reducing risk too much, in terms of the growth and innovation in the economy.”
Bernanke seems to be saying bubble and crash are the lifeblood of economies. No wonder the rich are getting richer. In the housing bubble, supply exceeded demand. Toxic loans then increased demand, until Bernanke pulled the plug.
18. January 2016 at 12:32
John, Sure, you can put in enough control variables to save the model. But I don’t find that a very useful model, because we cannot observe the output gap–at least not precisely enough to make it useful in monetary policy determination.
NGDP has two advantages over an output gap/inflation strategy. It’s a better goal variable than inflation, and it’s directly observable, unlike output gaps. So just keep NGDP growing at a steady rate.
Mark, You said:
“but why would declining unemployment be inherently disinflationary?”
It’s not, my point was that it would be expected to be disinflationary in this simple AS/AD model. If it were caused by a positive AD shock, it would be inflationary. So it all depends on the sort of monetary policy stance the Fed adopts.
Brett, Good point.
18. January 2016 at 14:09
So, Bernanke said, basically, that risk brings financial crisis. We know risk of default of loans in the housing bubble was mispriced. So he is saying mispriced risk brings financial crisis and we cause both the mispriced risk and the financial crisis.
He could have at least waited until the 5 year adjustable people could have refied into traditional mortgages before crashing it.
And people like Bernanke would never us NGDP targeting because then they would have to be honest. And they aren’t honest people. They are crooks.
18. January 2016 at 16:07
Scott,
“Sure, you can put in enough control variables to save the model.”
On the contrary, the only ‘saving’ I was doing was saving AS/AD from your mischaracterization. I was simply running through what happens in AS/AD when output is above and below potential.
If a central bank follows a regime that pegs NGDP growth to zero after an initial negative shock, then deflation will occur as output returns to potential. This is a prediction of AS/AD and, consequently also the Phillips Curve (since SRAS is the Phillips Curve — if this looks weird, it’s because I’m trying to figure out if html tags work in comment sections under wordpress and they turn out not to).
Don’t pretend that AS/AD does not have sticky prices, which imply a Phillips Curve. I suppose now you’re going to say that AS/AD could also be suggesting that wages are sticky. I guess that’s fair, but don’t keep saying that I’m ‘saving’ the Phillips Curve when I’m really just giving a more accurate explanation of the model you’re appealing to assuming sticky prices and not sticky wages.
18. January 2016 at 17:00
Excellent blogging.
In truth, there needs to be a global summit of the world major central banks, after which they issue a proclamation they will seek much higher rates of NGDP growth or much higher ITs for five years.
Another solution is to shrink the world’s economy to fit the present macroeconomic policies of central banks and national governments.
19. January 2016 at 05:02
Output gap is a nice concept for classroom, a poor tool for policy makers. Trying to estimate potential output and output gaps is a useless exercize. There are better, simpler tools to use …
19. January 2016 at 14:24
John, I don’t follow that. I agree that the SRAS is essentially the Phillips Curve. But the AS/AD model has three curves, LRAS, SRAS, and AD. Too much Phillips Curve analysis seems to assume the AD curve is the only curve shifting. Sure, I agree that AD shocks give you Phillips Curve results in the short run.
I don’t understand your claim that I mischaracterized AS/AD. Which sentence of mine was inaccurate?
19. January 2016 at 14:58
Scott, I am a bit confused. You often say that the US workers that left the labour force over the last few years are not coming back, due to demographic shifts or whatever, and hence US trend growth is now lower than before. But here you’re suggesting that the rise in employment and growth we have seen, coupled with low wage and price pressures suggests that the SRAS curve is shifting right, as workers adjust to lower nominal wage growth. If that’s the case, then how can you be sure that the participation won’t won’t continue to rise towards previous levels and hence trend growth has perhaps not fallen by as much as you presume?
19. January 2016 at 17:17
Scott,
“I don’t understand your claim that I mischaracterized AS/AD. Which sentence of mine was inaccurate?”
Here’s a list of sentences that I believe are inaccurate:
“It probably makes more sense to view the vertical axis as the inflation rate, rather than the price level.”
I understand that a lot of economists do this, but it’s effectively changing AS/AD from being a model with sticky prices to a model with sticky inflation. This implies that a negative output gap (short run equilibrium left of LRAS) implies decelerating inflation and vice versa. Unless you really wanted to analyze a sticky inflation model, you should have stayed with the price level as the vertical axis.
“The Phillips curve, in contrast, is just an AD model, and hence only 1/2 as good as the AS/AD model. The Phillips curve model says falling unemployment is inflationary, whereas the AS/AD model says when unemployment falls during a recovery (due to wage moderation) it is disinflationary. Which one better fits the facts?”
The Phillips Curve (equivalent to upward sloping SRAS curve) suggests that there will be deflation (assuming sticky prices instead of sticky inflation) as the economy returns to equilibrium. That is, inflation will be low if output is less than LRAS and high is output is above LRAS (until the price level has reached the equilibrium level). In other words, you mischaracterized AS/AD (specifically SRAS) as being significantly different from the Phillips Curve when they’re actually the same thing.
“In the standard AS/AD model, once you return to the natural rate, inflation will stay at the new lower level.”
Only if inflation is sticky instead of the price level. The price level will fall and remain low after adjustment. If the AD curve happens to always be shifting to the right, then the price level will eventually grow at the rate AD grows minus the rate LRAS grows.
“There’s utterly nothing in the AS/AD model that tells us inflation will rise when unemployment gets back to the natural rate.”
AS/AD tells us that the price level will go up if the AD and SRAS curves are to the right of LRAS. In Phillips Curve language, the price level will increase if unemployment (output) is below (above) it’s ‘natural’ level.
Basically, you’ve compared the Phillips Curve with itself and told us that you were talking about two different things. AS/AD is the exact same thing as a static model with sticky prices which is the exact same thing as a Phillips Curve.
What happens if there’s an SRAS shock? Well, this would be the ad hoc ‘cost push’ shock that economists add to the NKPC. The Phillips Curve is ‘AD only’ because it is the SRAS curve in every sticky price model in existence.
20. January 2016 at 06:32
Rajat, No I am saying the shift right in the SRAS is associated with the unemployment rate falling from 10% to 5%, not the LFPR rising.
John, You said:
“I understand that a lot of economists do this, but it’s effectively changing AS/AD from being a model with sticky prices to a model with sticky inflation. This implies that a negative output gap (short run equilibrium left of LRAS) implies decelerating inflation and vice versa. Unless you really wanted to analyze a sticky inflation model, you should have stayed with the price level as the vertical axis.”
This makes no sense to me. The Phillips Curve has inflation on the vertical axis. You said that was basically the SRAS curve. In any case a lot of modern econ textbooks are doing this switch, so it’s clearly not objectively “wrong”
You said:
“AS/AD tells us that the price level will go up if the AD and SRAS curves are to the right of LRAS. In Phillips Curve language, the price level will increase if unemployment (output) is below (above) it’s ‘natural’ level.”
That in no way contradicts the previous sentence, which discussed the economy being AT the natural rate.
So again, The Fed has no reason to assume that inflation will rise just because unemployment is falling. It may rise, but that’s not because of the AS/AD model.