

Nominal shocks have real effects
Michael Darda sent me a graph that provides another good example of how nominal shocks have real effects. The graph compares the spread between Baa bond yields and T-bond yields (white line) with an inverted measure of 30 years TIPS spreads (orange line). The TIPS spreads are inverted because the BAA/Treasury spread is a countercyclical variable, whereas TIPS spreads are procyclical:
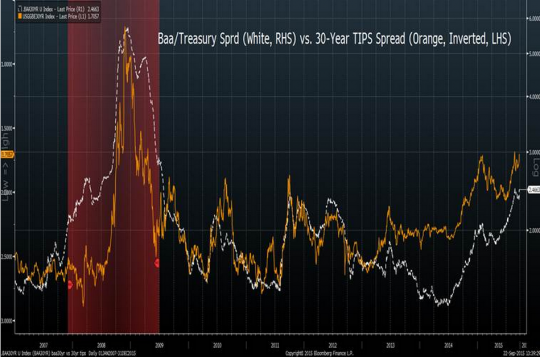
I really love this graph, because it shows an underlying relationship that many people over look. Always focus on the deep forces driving the macroeconomy, not the symptoms of those deep forces.
So here’s what’s going on. Tight money leads to lower expected future NGDP growth. I don’t think that can be disputed. And I’d also claim that slower expected NGDP growth usually leads to lower TIPS spreads. In addition, slower nominal GDP growth usually leads to increased fears of debt defaults. Recall that NGDP represents total gross nominal income, the total resources that people, businesses and governments have available to repay nominal debts. Squeeze that amount and defaults increase.
When NGDP grows more slowly, TIPS spreads fall and debt defaults increase. That is even true in an economy where wages and prices are flexible, but debt is denominated in nominal terms. But it’s even worse in the actual economy we live in, where wages are sticky. In that case slower NGDP growth also leads to lower RGDP growth, which puts even more pressure on borrowers, leading to even more defaults. Hence the Baa/Treasury spread widens. And note that the Baa/Treasury spread is a real variable. Hence nominal shocks have real effects.
Of course the correlation is not perfect because TIPS spreads aren’t really the variable we care about, it’s NGDP expectations that really matter. Notice the gap in the first half of the recession (roughly the first half of 2008.) That was a period where inflation diverged sharply from NGDP growth. Money was tighter than the inflation numbers suggested.
Tags:
24. September 2015 at 05:09
Could you link to a bigger picture of the graph, the legends and axes are unreadable.
24. September 2015 at 05:11
There also seems to be a gap from 2013 onward. What do you make of that?
24. September 2015 at 05:41
David, Sorry, I don’t know if it’s available online. On the left scale you have the TIPS spreads (inverted.) Counting down from the top, 1.0, 1.5, 2.0, 2.5, 3.0. The current position, market in orange, is around 1.75%
On the right axis you have the Baa/Treasury spread. Counting down from the top 6.0, 5.0, 4.0, 3.0, 2.0. The current position is around 2.4%.
Michael. I’m not sure, but my best guess is that it reflects “level effects.” I.e., the slow economic recovery will gradually reduce risk spreads, even if TIPS spreads are unchanged. This is because over time more contracts are negotiated reflecting the new reality. However changes are still rather highly correlated.
24. September 2015 at 06:06
Thank you the axes explanation!
24. September 2015 at 06:26
Print more money.
24. September 2015 at 08:24
Speaking of effective graphs;
http://www.cato.org/blog/pope-francis-graph-day
‘It shows that in 1896, income per person in the United States and Argentina, two of the richest countries in the world, was about identical. Argentina subsequently eschewed the free market, replacing it with trade protectionism and other corporatist policies intended to help the poor by redistributing wealth. By 2010, Argentine income was a third of that of the United States.’
24. September 2015 at 10:52
Agree, awesome graph. Thanks for sharing Michael!
24. September 2015 at 11:51
2013 onward…. Defaults have been low. This has caused corporate bond spreads to tightening. At the same time, economic growth has been running at this positive but not very strong so that inflation expectations have been declining.
The ideal level of economic growth for corporate bond investors is this positive, but not to strong growth rate. When growth gets to be too strong, then companies tend to increase leverage, first supply explodes, and then defaults increase.
24. September 2015 at 11:52
So, money isn’t neutral….at least isn’t over a time-frame of indeterminate length.
24. September 2015 at 12:30
Doug, Short run non-neutral, long run neutral.
24. September 2015 at 14:29
The Janet has spoken;
http://www.wsj.com/articles/janet-yellen-says-fed-interest-rate-increase-still-likely-this-year-1443128438
She has charts and graphs too;
‘Federal Reserve Chairwoman Janet Yellen laid out her most detailed case yet for the central bank to begin raising short-term interest rates later this year, effectively lobbing a warning to financial markets that the central bank’s decision to keep rates near zero last week wasn’t a shift toward an interminable delay of monetary tightening.’
24. September 2015 at 16:17
“Always focus on the deep forces driving the macroeconomy, not the symptoms of those deep forces.”
You don’t really believe that, you’re just saying that.
We know this because you focus on the symptom of sudden widespread increases in cash preference, namely falling NGDP, and you purposefully evade and ignore the deep forces that caused the rise in cash preference, which we know is previous inflation that distorted the capital structure and labor allocation throughout the economy.
NGDP is itself a symptom. It is the ongoing culmination of spending on final goods after spending on input factors. Investment precedes consumption.
Yet you interpret NGDP the same way Keynesians interpret it: As the fundamental driver of real productivity.
I can assure you that central bank activity, which are relatively new institutions in the history of mankind, a “deep” driving force in the economy. It is a hampering institution no doubt, but it does not replace actual “deep” economic forces that move the world.
24. September 2015 at 16:21
“…are NOT a “deep” driving force…”
24. September 2015 at 18:22
Folks, this is misrepresentation at its finest. First, Sumner does not have a clearer graph, despite this being a loved graph, so it’s clearly smoke and mirrors. Second, the two variables red and white seem coincident. Whatever they are measuring it’s not that nominal variables lead real variables. New name for Sumner: the axis of evil, since he misrepresents an X-Y graph.
Instead of sleights of graph, why don’t Sumner read and comment on Ben S. Bernanke et al’s 2003 FAVAR paper (found online, do the keyword search) that found between 3.2% to 13.2% effect of Fed actions on real variables, for the period from the late 1950s to 2001. While this is statistically significant, readers will agree it’s almost trivial. And this paper is a real econometrics study, not a magic trick.
25. September 2015 at 11:07
Prof. Sumner,
just today I was at a symposium where Emanuel Moench (Bundesbank) presented the following paper where he (together with NY Fed coauthors) estimates a model to decompose the TIPS spread essentially into three components: 1) liquidity premium, 2) inflation risk premium (as measured by the estimated difference of nominal and real forward term premia), 3) expected inflation
http://www.newyorkfed.org/research/staff_reports/sr570.pdf
From what I understood, their key result is in figure 7 on p.55 in the lower-right panel, where basically the entire variability in the TIPS spread from 1999-2014 is accounted for by changes in the inflation risk premium, while – surprise, surprise – actual inflation expectations remained almost constant around 2.4% (the red dashed line in the figure). And that’s even during the crisis and during all policy changes with regards to QE, forward guidance etc.
Obviously their results might depend heavily on their empirical model, but I was still wondering what your take on this would be.
25. September 2015 at 18:17
Central banking brings about a perpetual “monetary shock”.
One of Summer’s flaws is his unwillingness to not only study the real effects that are a result of “normal” inflation, but to write about even the possibility that “normal” inflation causes calculation errors to accumulate over time.
The only monetary “shocks” he ever addresses are the self-serving shocks in the downward direction. For that lends some plausibility to the (actually false) notion that recessions have nothing to do with prior inflation distorting the capital structure of the economy, and everything to do with the symptoms later on of rising cash preference and falling spending.
26. September 2015 at 11:30
Ninive, Thanks for the link. I’m skeptical of any study that says inflation expectations have been stable since 2000. For instance, trend wage growth has slowed dramatically. The dollar has moved around dramatically. And of course actual inflation plunged in the steep recession of 2008-09, surely that was at least partly expected, once the severity of the recession became clear. Indeed the only mystery (according to people like Krugman) is why inflation didn’t fall even further.
Are they talking about very long term inflation expectations? That’s certainly possible.
27. September 2015 at 10:59
Thanks alot for your reply. They consider 10-year “spot” as well as 5-10-year forward rates, so admittedly a rather long horizon. Still, I was curious what you might think of their results given that they a) (conveniently) pretty much exculpate the Fed, at least on the inflation side, and b) might call into question reading too much into short-term inflation market forecasts (and, by analogy, NGDP?) as well.
28. September 2015 at 11:44
Ninive, It’s possible that very long run expectations have been relatively stable, but I’m more interested in 5 year expectations.