

Is China’s GDP growth 3.2% or 60%?
China just reported 3.2% GDP growth in Q2. That number sounds about right to me. But I can’t help noticing that if China reported its GDP growth rates the way the US government does, it would have reported roughly 60% growth in Q2. At least I think it would have; see if you can follow my argument and correct any errors:
China’s GDP data shows year-over-year growth. Thus Q2 GDP in China was 3.2% above 2019:Q2. But how much did it grow relative to last quarter?
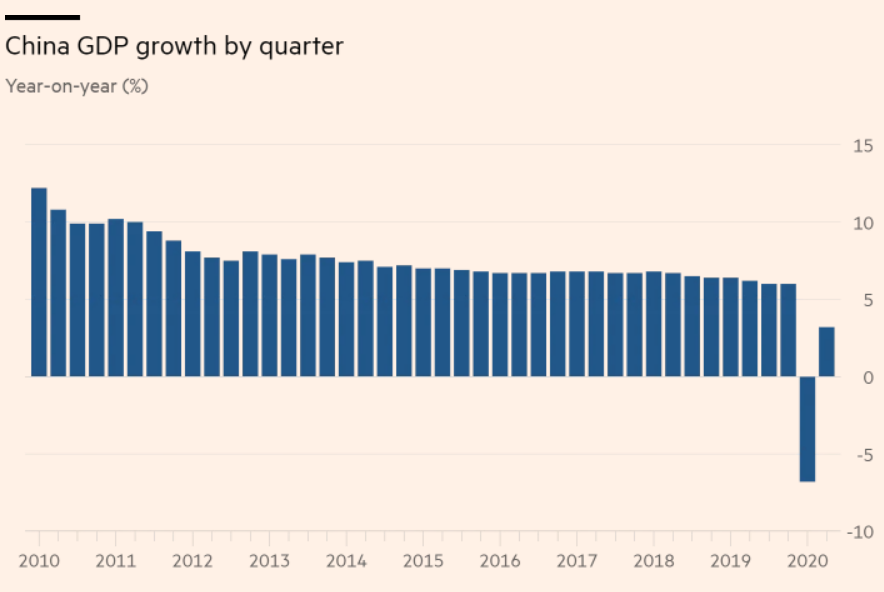
In Q1, China’s GDP fell by 6.8% relative to 2019:Q1. But how much did it fall by compared to the previous quarter? My guess is that it probably fell by at least 11% from 2019:Q4, as prior to Covid-19, China’s GDP had been rising at a fairly steady rate of roughly 6%/year. If China’s GDP in 2019:Q4 was 4% or 4.5% above 2019:Q1 GDP, then the plunge from the peak in 2019:Q4 to the trough in 2020:Q1 would have been roughly 11%. Does that make sense?
Now consider 2020:Q2 GDP, which was 3.2% above 2019:Q2. Given the 6% annual trend growth, it seems likely that by 2019:Q4, China’s GDP was roughly 3% above 2019:Q2 levels. Thus China is basically claiming that the 2020:Q2 GDP has roughly returned to the levels of the end of last year.
To summarize, China’s GDP fell by roughly 11% in Q1, and returned to roughly the 2019:Q4 levels in the second quarter. That means the growth in the second quarter was a bit over 12% (the growth rate of going up from 89 to 100.)
So where do I get the 60% figure in the post title. It turns out that the US does not report quarter-over-quarter growth rates for GDP; we report quarter-over-quarter growth rates that have been annualized. Growing from 89 to 100 is a bit over 12%, but if you annualize that rate (including compounding) the rate is close to 60%.
The weird thing here is that usually when growth rates between countries are non-comparable it’s because one is a 3-month rate (as in Europe) and one is a 12-month rate. But both the US and China report 12-month growth rates. It’s just that China reports the growth rate over 12 actual months, whereas we look at growth over 3 months and then annualize it. In this case, the two techniques produced stunningly different results.
Soon the US will report Q2 GDP data, which will likely look awful. This post suggests that it won’t be quite as awful as the headline figures suggest (although it obviously won’t be good.)
PS. The best way to report GDP growth is to provide the growth rates according to both the US and Chinese technique. These two figures are more informative about the current state of the economy than either rate in isolation. They each tell us something useful that the other figure does not. So don’t fall into the common mistake of trying to figure out which approach is best. You need both!
Tags:
16. July 2020 at 09:05
The releases from the BEA have both the YoY and QoQ annualized numbers. It’s in table 6 of the link below. It’s just that the release’s text emphasizes the QoQ annualized numbers, which is what the investment industry and financial press tend to focus on.
https://www.bea.gov/sites/default/files/2020-06/gdp1q20_3rd_1.pdf
You say “The weird thing here is that usually when growth rates between countries are non-comparable it’s because one is a 3-month rate (as in Europe) and one is a 12-month rate. But both the US and China report 12-month growth rates. ”
This would be a bit clearer if the adopted the terminology used by the investment industry, which is that the 3-month rate is a QoQ rate, the 12-month rate is the YoY rate, and the US reports the QoQ annualized rate.
Another confusing point that is not frequently mentioned is that the US reports GDP levels as seasonally adjusted at annualized rates. So to go from the level of quarterly GDP to annual GDP, you actually need to average them instead of sum them.
16. July 2020 at 10:31
John, Good points.
16. July 2020 at 10:37
Interesting,
One thing that is curious is the continued strength of the US Dollar, why has it remained so strong throughout this crisis? Goldman Sachs came out with a study saying that the yuan would appreciate to a 6.7 ratio, but that would be just a 3% appreciation in relative terms. Given that China had 60% QonQ growth and US will have likely have a 25% QonQ decrease, why did the relative ratio’s in currency not shift so much? Wouldn’t such a dramatic shift in fortunes lead to a much sharper appreciation of the Yuan?
In that regard, the US is even stronger with respect to the Yen and the Taiwanese Dollar, even appreciating relative to those two currencies. Why is that, Taiwan and Japan are seeing growth, while the US is seeing a decline.
I really dont understand currency markets… I know that Lars Christensen has been bullish on the US Dollar, claiming that America’s nominal GDP would not be surpassed by China’s, but that was before the coronavirus crisis, and yet it looks like it will be correct. Anyone got a gander?
16. July 2020 at 11:08
Moldburg, Are you sure that Japan is seeing growth? Is there a link?
16. July 2020 at 11:46
Go to FRED. It tells you the GDP at end of 1Q this year (20.65 trillion Yuan).The second quarter last year was 24.257 trillion yuan. 3.2% higher (that is tha annual number relative to a year ago) means this year GDP at 2nd quarter is 25.033 which is a 1 quarter change of 21.2% change in absolute terms versus the first quarter this year! That gets you your 60% or so annualized. Somehow I do not think this is how we would report it—but I get the same result as you.
16. July 2020 at 11:51
Actually 1.212% ^ 4th equals 117%
16. July 2020 at 11:58
But they were down 25% plus in absolute terms in the first quarter according to FRED—versus the prior 4th quarter of 2019, Fred just prints what GDP is–no growth — CHNGDPNQDSMEI—-so we have that too—–
16. July 2020 at 12:11
I just wish they would print the actual absolute level of GDP in nominal terms, no seasonal adjustments—which is just curve fit junk anyway—they can print all the other stuff they want to, but the most basic of all data is the absolute level of NGDP
16. July 2020 at 12:33
Scott,
I’m pretty sure that there is a causal link between the wealth of a country and their relative position in the currency markets. As a country grows richer relative to other countries, their currency should appreciate in relative terms to other countries. That is what we usually see, with the exception of some East Asian countries, whose PPP numbers are just ridiculous. Singapore apparently has half the nominal GDP it does PPP, which makes no sense if markets are efficient.
I was wondering what you thought about Lars Christensen’s arguments on the USD and the US versus China.
16. July 2020 at 12:34
GDPNOW is -35annualized in US versus China 2nd quarter of -70% annualized.
These numbers are crazy—but that is what they are
16. July 2020 at 12:37
I meant China 1Q -70% annualized
16. July 2020 at 15:05
https://www.actionforex.com/live-comments/311377-china-gdp-grew-3-2-yoy-in-q2-june-retail-sales-weak/
China officially reported 11.5% quarter-over-quarter growth in Q2.
Yes, if you annualize that rate you will get a high figure. (1.115 to the fourth, minus the 1)
The real challenge for Western economists is to explain by what methods China obtained such a vigorous rebound.
Was it fiscal policy or monetary policy, a combination of both? Eased credit conditions and a compliant banking system? Does the People’s Bank of China plan to acquire sour loans in the future? (in the past the PBOC has set up asset management companies to siphon bad loans out of their commercial banking system).
What is flabbergasting is that China can obtain such a great result without any intellectual curiosity on the part of Western macroeconomists.
I sure would like to know how China did so well, but then I am untrue to any ideology, theology, or theories.
16. July 2020 at 15:07
Moldburg,
International exchange rates are much, much more complicated than that…
16. July 2020 at 15:15
Sumner: “Are you sure that Japan is seeing growth? Is there a link?”
Japan’s GDP was down an annualized 8% in late 2019 and down 2% in Q1 this year but the unemployment rate is only 2.9%, up from 2.4%, so Japan has so far avoided a recession. Ain’t that right, Scott?
16. July 2020 at 15:33
If you want to analyze it, China reported 54.6% GDP growth in Q2
16. July 2020 at 16:22
Moldburg, I agree that other things equal a currency will appreciate with more wealth (Basically the Balassa-Samuelson effect.) But there are many other factors. The strength of US high tech is one thing pushing the dollar higher.
Todd, I suspect they may be in a recession, but time will tell. GDP in Japan certainly doesn’t tell us if they are in recession, that’s for sure!
16. July 2020 at 17:39
Doesn’t the dollar always tend to appreciate in a “crisis”? And wouldn’t Covid qualify?
16. July 2020 at 19:07
Scott,
True, but the Yuan has depreciated relative to the Euro during this crisis as well, and they were hit very hard as well economically.
With respect to the US high tech story, that is also true, since the yuan has appreciated relative to the yen(who’s tech sector is no longer dominant) strongly. However, the yuan has depreciated relative to the Euro over the last five years, despite Brexit and the fact that the EU has no real tech industry of note.
The weirdest thing is not even China but India. India’s nominal GDP and its PPP have a ratio of 4(wow!). I know some PPP numbers for certain countries are just not accurate, but I have no idea how such a gap can exist. Something either is wrong with the PPP numbers or the currency markets.
16. July 2020 at 19:45
Scott, your estimates were pretty spot on. Q-on-Q growth, not annualized, was 11.5%
16. July 2020 at 20:01
“Todd, I suspect they may be in a recession, but time will tell. GDP in Japan certainly doesn’t tell us if they are in recession, that’s for sure!”
I think a huge drop in GDP for two quarters is defiantly a recession but also keep in mind that in Japan hours are cut back sharply in bad times, which this is.
16. July 2020 at 20:27
RE Michael’s comment below….
“I just wish they would print the actual absolute level of GDP in nominal terms, no seasonal adjustments—which is just curve fit junk anyway—they can print all the other stuff they want to, but the most basic of all data is the absolute level of NGDP”
Amen. You took the words out of my mouth. But if they reported things this way, how would ivory tower economists justify their employment? They could no longer blog about the pros and cons of the relative vs absolute reporting of a measure that has been more manipulated than sumner’s perception of reality….
I looove to hate this blog!
16. July 2020 at 23:51
Never reason from an exchange rate change, people.
17. July 2020 at 04:47
I realize this blog is not meant for 3rd graders but on Fred site “CHNGGDPQDSMEI” shows different numbers than Scott’s and Ben’s. The symbol is above and the name is “Current Price Gross Domestic Product in China”. It appears this chart shows trailing 12 month GDP measured in current prices at each quarter. Anyone want to help?
17. July 2020 at 04:58
JPMorgan’s estimate of seasonally adjusted annual rate
Country Q1 Q2 * stands for forecast
US -5.0% -31.0%*
CN -35.8% 56.5%
EA -13.6% -40.0%*
JP -2.2% -27.0%*
17. July 2020 at 07:55
Moldburg, India’s easy to explain with the Balassa-Samuelson effect. It’s a very poor country, and also labor intensive. I’d guess that haircuts in India cost maybe a dollar. Also, they are better at services than manufacturing. Put all that together . . .
17. July 2020 at 08:03
msgkings, Yes, quite often it does appreciate in a crisis.
Thanks Michael—I just got lucky.
Todd, Fair point about hours worked.
Nick, Glad I give you something to love.
Tacticus, Yup.
HL, Where did the EA abbreviation come from? Is that the EU?
17. July 2020 at 13:56
Yes you are correct. Not an ISO alpha-2 code yet (seems EZ has been reserved for that purpose however), but used by EU for publications, etc. It is a common abbreviation used by sell side brokers.
17. July 2020 at 16:24
The Bank of Indonesia is directly monetizing a large portion of that nation’s national budget deficit.
The BI has a sensible 2% to 4% inflation target. The expectation is that the BI will miss its target…on the low side.
It is a bit muddy, but it looks like the BI is also paying for a program of small and medium business loans.
Japan, China, Indonesia…and orthodox macroeconomic theology. Is there intersectionlity? Actually I don’t know what “intersectionality” means. But why should anything be real when discussing macroeconomics?
21. July 2020 at 19:03
John Hall, I suspect you might have to do a geometric average to get from four American quarterly numbers to a yearly one? Arithmetic average would probably not work?
(Of course, if you do a geometric average, you have to average 1+reported quartly number, not the raw percentage.)