Archive for the Category Monetary policy stance


Eliminate the LM curve? Only if we also eliminate the IS curve

Over at Econlog I have a post criticizing Olivier Blanchard’s suggestions for improving the way we teach macro.  Blanchard wants to focus on the IS relationship, and pretty much discard LM:

The LM relation, in its traditional formulation, is the relic of a time when central banks focused on the money supply rather than the interest rate. In that formulation, an increase in output leads to an increase in the demand for money and a mechanical increase in the interest rate. The reality is now different. Central banks think of the policy rate as their main instrument and adjust the money supply to achieve it. Thus, the LM equation must be replaced, quite simply, by the choice of the policy rate by the central bank, subject to the zero lower bound. How the central bank achieves it by adjusting the money supply should be explained but can stay in the background. This change had already taken place in the new Keynesian models; it should make its way into undergraduate texts.

I’d rather get rid of IS/LM entirely, but if we insist on using the model, then I’d prefer we keep LM.  Even with the complete IS/LM model, economists often fall into the trap of reasoning from a price change.  For instance, they often assume that a fall in interest rates represents an easy money policy, even though the IS/LM model clearly suggests that it might also reflect a leftward shift in IS:

Screen Shot 2016-06-04 at 10.33.46 AM

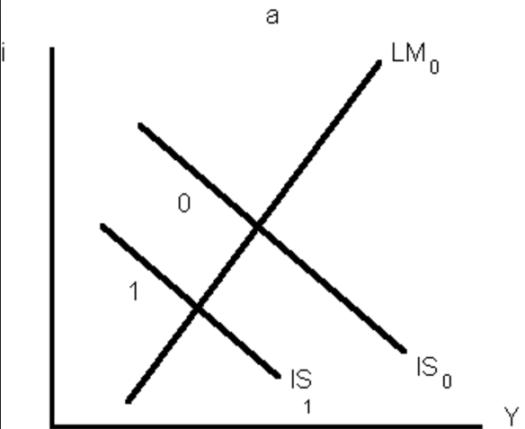
Now suppose we get rid of the LM curve, as Blanchard proposes, and instead assume that the interest rate represents monetary policy.  Won’t students be even more likely to make this mistake?

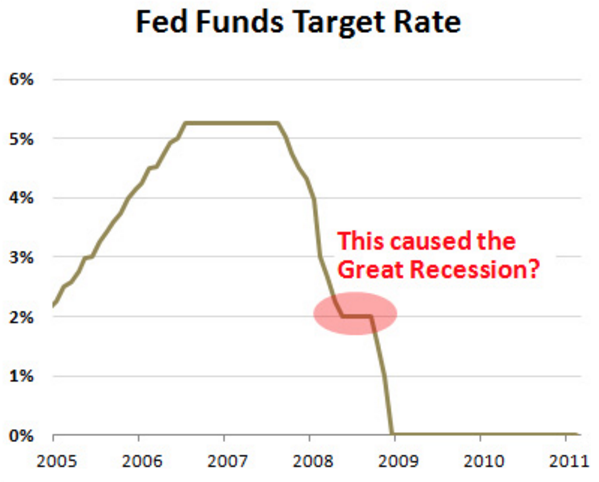
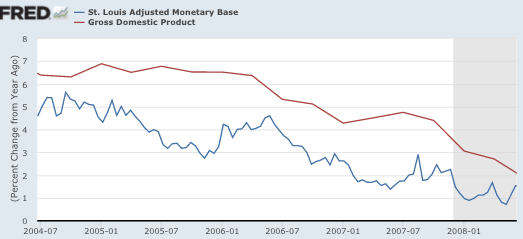
My favorite example is the period from August 2007 to May 2008, when the growth in the monetary base (which had averaged a bit over 5% in the previous decade, came to a halt.  This led to a sharp slowdown in NGDP growth, triggering the recession (albeit not yet a “Great” recession.)  Indeed it appears the Fed triggered the Great Recession regardless of whether you accept my NGDP view of the stance of monetary policy, or whether you prefer the old “concrete steppes” approach—was the Fed injecting new money into the economy. My worry is that people will confuse the following two graphs:

Screen Shot 2016-06-04 at 10.51.35 AM

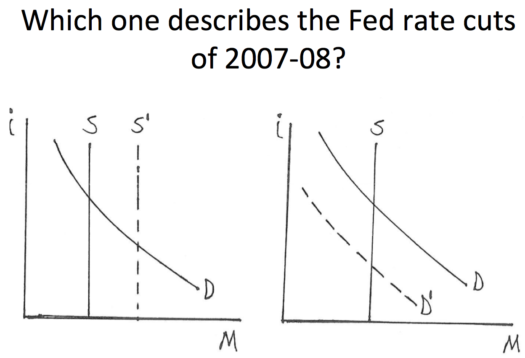
The graph on the right shows what actually occurred during the onset of the Great Recession. But if we eliminate the LM curve, as Blanchard suggests, then most students will assume the graph on the left shows what happened during late 2007 and early 2008.  It will look like monetary “stimulus”. They won’t even consider the possibility that tight money might have triggered the Great Recession, as money “obviously wasn’t tight”.

What I find so maddening about all this is that we already have a macro misdiagnosis problem, and the changes proposed by Blanchard will make that problem even worse.

PS.  Although I often talk about 2007-08, there are lots of other examples.  Both the monetary base and nominal interest rates fell sharply in 1920-21 and again in 1929-30.  In both cases money was clearly tight, as the reduction in the monetary base caused NGDP to plunge sharply.  But those who focused on interest rates saw policy as being “accommodative”.  If you misdiagnose the cause of the Great Depression, how likely is it that you’ll come up with effective remedies?

HT:  Marcus Nunes


Kevin Drum on Fed policy during 2008

Here’s Kevin Drum:

I think you can argue that the Fed should have responded sooner and more forcefully to the events of 2008, but the problem with Cruz’s theory is that it just doesn’t make sense. Take a look at the chart on the right, which shows the Fed Funds target rate during the period in question. In April 2008, the Fed lowered its target rate to 2 percent. Then it waited until October to lower it again.

So the idea here is that if the Fed had acted, say, three months earlier, that would have saved the world. This ascribes super powers to Fed open market policy that I don’t think even Scott Sumner would buy. Monetary policy should certainly have been looser in 2008, but holding US rates steady for a few months too long just isn’t enough to turn an ordinary recession into the biggest global financial meltdown in nearly a century.

Actually, according to New Keynesian (NK) economic theory (not my theory) it certainly could be enough.  According to NK theory, when interest rates are positive the central bank controls the path of NGDP.  Notice that interest rates were positive throughout 2008 (until mid-December.)

Also, according to NK theory, you can’t look at the path of the fed funds target to figure out the path of monetary policy.  Ben Bernanke says you need to look at NGDP growth and inflation.

According to NK theory what really matters is the gap between the policy rate and the Wicksellian equilibrium rate. According to NK theory you’d expect the Wicksellian equilibrium rate to fall sharply in a housing crash/recession. And it did. According to NK theory that means Fed policy tightened sharply in 2008.  According to Vasco Curdia (a distinguished NK economist who has published papers with Michael Woodford) the policy rate rose far above the Wicksellian equilibrium rate in 2008.

In other words, according to NK theory Kevin Drum is wrong; policy got a lot tighter. Now we can debate what the Fed might have accomplished with various counterfactual policies, but there is no doubt that the actual policy became extremely tight in the second half of 2008.  Recall that in mid-year the Fed did not expect a severe recession, they thought the economy would grow between 2008 and 2009.  So something unexpected went wrong in the second half of 2008, and we know from high frequency output data that the sharp deterioration of the crisis preceded the intensification of the financial crisis in October.  Not for the first time, a crash in NGDP expectations led to a crash in asset prices, which led to the failure of highly leveraged banks.

Drum presents this graph:

Screen Shot 2015-12-06 at 2.23.14 PM

and then wrongly assumes it tells us something useful, that it helps us to understand how policy played out in 2008.  It does not.  Yes, the rate cuts of April and October made policy less contractionary on those days than if rates had not been cut, but it doesn’t tell us anything about the overall stance of policy, and how that stance evolved over the course of 2008.  As Frederic Mishkin says in his best-selling money textbook (and Ted Cruz agrees) for that you need to look at a wide range of asset prices.

Both the NK and MM models tell us that money got much tighter in the second half of 2008.  Ironically, Ted Cruz seems more aware that fact than many of his critics.

PS.  Notice that the Drum quote starts off, “I think you can argue. . .”  Drum’s being too polite here.  It’s like saying, “I think you can argue that the captain of the Titanic should have reduced the speed of the ship in the iceberg corridor.”  Yeah, I’d say so.

PPS.  On the other hand I wish more bloggers (including myself) were more polite, so no disrespect to Drum intended.

PPPS.  Over at Econlog I link to a great Tim Fernholz article (on Ted Cruz) in Quartz.


Markets set interest rates

Patrick Sullivan sent me a link to a talk by John Taylor.  Around the 15 minute mark Taylor recounts an amusing conversation he was part of with James Tobin and Paul Volcker, back in 1982:

I remember very well Jim [Tobin] asking Paul “Why don’t you lower interest rates, Paul?”  And Paul Volcker said, “I don’t set interest rates; I set the money supply and the market reacts [with] the interest rate.”

John seemed to say “to” not “with”, but in context I think he meant, “reacts with changes in interest rates.”

I love that quote.  Great to know that central bankers occasionally see the light.

Those who want higher interest rates need to tell me precisely what they want the Fed to do to cause rates to be higher.

PS.  I have a new post at Econlog.  The first of many, many posts to comment on Bernanke’s new memoir.

PPS.  Bob Murphy has a new post criticizing my recent post on real shocks.  He starts off as follows:

Sumner’s whole purpose with this post is to argue that shocks in “real” factors can have huge impacts on welfare. However, they do not correspond to the business cycle. So long as the central bank exercises wise monetary policy, real shocks can be offset and full employment can be maintained. In contrast, we don’t need a real shock to get a recession and rising unemployment; all we need is the central bank to stupidly let NGDP growth fall below trend.

Actually, there are real shocks like a $20 minimum wage that could cause recessions and much higher unemployment.  I was trying to show that as a practical matter the fluctuations in unemployment in the US and Australia are mostly about NGDP shocks. I probably should have been clearer; sometimes I assume there are certain things that “go without saying.”

In the rest of his post Bob belatedly discovers something I have said dozens of times here over the past 5 years, that for commodity exporters like Australia I view total nominal labor compensation as better than NGDP.  I’ve also explained why this compromise is a clear implication of the musical chairs model.  Bob seems to think that somehow undercuts my whole message, but I’m not quite sure why nuance is worse than fanatical devotion to fitting one single model into all conceivable circumstances. I’m a pragmatist, so sue me.

But yes, I should have made that point explicit in the post.

Don’t tell me the facts, I’ve already made up my mind

On some days that’s my impression of the economics profession.  They’ve made up their minds that the financial crisis (not tight money) caused the recession.  When I point to the huge decline in NGDP growth, they insist that’s not monetary policy. They say, “It was a fall in velocity, not tight money.”  And yet that’s not true, base velocity was actually rising as the Fed drove the economy into recession.  As you can see from the following graph, the Fed gradually squeezed growth in the monetary base, until by early 2008 the year-over-year percentage growth rate of the base had fallen to about 1%.  This gradually squeezed year over year NGDP growth, which slowed to 2% by mid-2008 (and much worse later on.)

Screen Shot 2015-09-13 at 3.26.15 PM

Just to be clear, I’m not suggesting the monetary base is a good way of thinking about the stance of monetary policy, it’s not.  I’m just pointing out that the “concrete steppes” people who insist it’s not the Fed’s fault if V falls, only if the Fed does something concrete with the base, themselves never bother to look for concrete steps.  If you tell them that the onset of the recession can easily be accounted for by this concrete action, they’ll still deny the Fed caused the recession. They’ve already made up their minds. Facts simply don’t matter.

Others will insist that monetary policy is all about interest rates. If you ask “real or nominal” they’ll say real rates.  Real rates did fall in the early stages of the recession, as is often the case, but then something really weird happened.  Real yields on 5 year TIPS soared between the spring and fall of 2008, as unemployment began to rise sharply.  If you point this out, they’ll still deny there was any tight money, because they’ve made up their minds that tight money could not possibly be to blame.

Screen Shot 2015-09-13 at 2.53.43 PM

The economics profession considers the Fed to be sort of like the Pope, basically infallible, except for tiny errors induced by data lags.  Any shock to AD can’t possible be caused by the Fed, because they fix problems, they don’t cause problems.  Here’s James Alexander, posing a question to Tony Yates:

I think Yates’ course might be interesting but would it really help me with my questions.. The blogsphere is alive with debate on them and sometimes academic papers are referred to, but most seem unsatisfactory in one way or another.

Anyway, would they help answer this question: Would you ever create a model that included occasional, but deeply random tightening and loosening of monetary policy by central banks?

To this one he [Yates] answered: “Yes, if you thought central banks faced measurement error in real time, or changes in committee membership that meant changes in the preferences of the median committee voter. Have a look. Large literature on just that.”

I think Yates is expressing the mainstream view.  We can draw an AS/AD diagram, and ask our students what would happen to AD if there were an expansionary or contractionary monetary shock.  But deep down the profession doesn’t believe those shocks are important.  Rather they think there are non-monetary AD shocks, which central banks offset with more or less skill.  But surely central banks wouldn’t just create a negative AD shock out of thin air?  The ECB wouldn’t just suddenly raise interest rates in July 2008, or April 2011, would they?  Bueller, are you paying attention?

This faith in central bankers is what I reject.  I see no reason at all to assume that 2007-09 was not a massive negative AD shock, caused by a series of central bank errors of commission and omission.  These occur due to a complex mixture of data lag problems (correctly identified by Yates), ignoring market signals, and a deeply flawed model of monetary economics that focuses on growth rates, not levels.  All three flaws came together in 2008.  First the economy began to slump.  That’s the data lag.  Then the markets recognized the problem, but the Fed still did not. That’s ignoring market signals (i.e. Sept. 2008).  Then when even the Fed realized the problem, they refused to commit to bring NGDP (or even the price level) back up to the previous 5% (or 2%) trend line.  Put these three together and you get a massive negative monetary shock and the Great Recession.

PS.  I was recently interviewed by the Frankfurter Allgemeine.  Here is an excerpt:

Screen Shot 2015-09-13 at 4.36.35 PM

The article is gated, and costs 2 euros.  (Most of the article discusses Larry Summers, not me.)

Gavyn Davies on 4 types of shocks

James Alexander pointed me to a fascinating piece by Gavyn Davies in the FT.  In this table, he summarizes the impact of 4 types of shocks on the various markets:

Screen Shot 2015-09-10 at 6.20.33 PMI don’t think those results always hold up (tight money can sometimes reduce real rates) but it’s pretty reliable in most cases.  Davies then argues that in recent months the behavior of markets is most consistent with monetary tightening by the Fed:

There are important conclusions from these charts:

  • The behaviour of US equities since mid 2014 has been impacted on by two supportive shocks, and two depressing shocks.

  • The supporting shocks have been a decline in risk aversion (presumably driven by a drop in the risk of a major crisis in the euro area after quantitative easing by the European Central Bank became likely), and a positive aggregate supply shock from lower oil prices.

  • The depressing shocks have been a significant monetary tightening shock as the Fed has approached lift-off, and more recently a minor negative demand shock that could have stemmed from China or the domestic US economy.

  • These shocks roughly cancelled each other out until May 2015, since when the negative shocks have started to outweigh the positive ones.

  • The sharp decline in equity prices since June 2015 has been mainly driven by a monetary tightening shock, rather than by a negative demand shock from China or elsewhere. This was initially partially offset by a beneficial supply shock from lower oil prices, but in the last couple of weeks this has reversed as oil prices have rebounded.

  • In September, the monetary shock has dampened slightly as Fed speeches have reduced expectations of a September lift off for US interest rates.

This methodology is not infallible so a sanity check is important: does it seem plausible that the model attributes much of the weakness in risk assets to a “monetary shock”? Some people will be sceptical about this, because there has been no increase in US interest rates, and no change in the Fed’s balance sheet in recent months. However, the rise in real bond yields and the decline in break-even inflation rates is clearly indicative of perceived monetary tightening. And indicators of overall financial conditions have clearly tightened. No other shocks can plausibly explain this combination [2].

Furthermore, over the past couple of weeks the timing of the ups and downs in the markets has been exactly what would be expected from the varying signals thatWilliam Dudley, Stanley Fischer and John Williams have given the markets. So this result seems fairly robust.

The most likely inference is that the markets have observed the adverse developments emerging from China, especially the possibility of further devaluations in the renminbi, and have concluded that the Fed would normally ease policy in response to these deflationary risks. Yet the Fed has seemed to be on a pre-determined path to announce lift-off before the end of the year, and has been very reluctant to deviate from that tightening path. This has been interpreted by the markets as a hawkish shift in the Fed’s policy framework.

The case for postponement of lift-off was argued strongly by both Martin Wolf andLarry Summers in the FT yesterday. The Fed will probably heed these arguments. If they do not, financial turbulence could swiftly return.

Great stuff.  Let me just add one point.  Between July and November 2008 there was a shock to the stock market, real bond yields, and TIPS spreads that was almost an order of magnitude bigger than the recent shock.  A huge shock, and according to the model presented by Davies it must have been a contractionary monetary shock.

Funny that everyone thought I was crazy when I first made that claim.

We are making progress if the FT is now publishing claims of a contractionary monetary shock during a period of very low interest rates and a bloated monetary base. Next time another 2008 happens, we MMs won’t be laughed at.  (Even better, this recognition makes another 2008 less likely.)