

Another example of monetary offset
Yawn. Another year, another example of monetary offset.
As it became clear in late July that Congress was unlikely to extend the stimulus, Keynesian pundits went into full freakout mode, warning that the recovery would be aborted. Perhaps it will be aborted—I can’t predict the path of the Covid-19 epidemic. But one thing seems clear, the end of the expansion won’t be due to a negative AD shock—as inflation expectations are rising significantly:
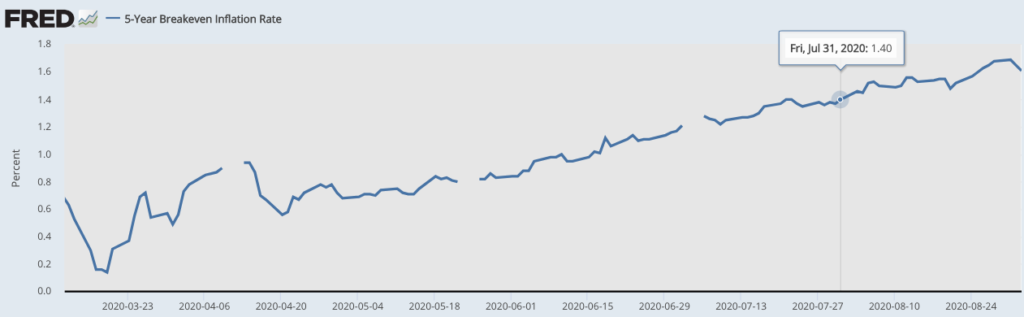
At the end of July, the 5-year TIPS breakeven rate was 1.4%. Today it’s at 1.61%. That’s still far too low, but at least it’s a step in the right direction. If ending fiscal stimulus had produced a negative demand shock, you’d have expected inflation expectations to have fallen.
Several factors probably explain this result, but many experts believe the Fed’s recent adoption of average inflation targeting has helped to boost inflation expectations. (It’s hard to quantify the effect, as the announcement was somewhat anticipated, and the post announcement commentary by Fed officials also has an effect on market perceptions.)
Evidence from the TIPS market suggests that this will be just one more in a long list of Keynesian policy misjudgments resulting from the failure to account for monetary offset. The earliest example I recall took place in 1968, when Keynesian economists wrongly thought the Johnson tax hikes would slow inflation, as they failed to account for (stimulative) monetary offset. Even today, there are still economists out there who believe that fiscal policy drives inflation. Outside of bankrupt countries such as Venezuela, that’s just not true.
PS. Monetary policy is still somewhat too tight, but given the way Covid-19 distorts almost all of the economic data, I’m reluctant to be more specific than that.
PPS. Some people prefer the 5-year, 5-year forward breakeven. That graph shows the same pattern, albeit a somewhat higher expected rate of inflation.
Tags:
3. September 2020 at 10:03
“Some people prefer the 5-year, 5-year forward breakeven”
The reason why is that 5y TIPS are more sensitive to oil than 10y TIPS
3. September 2020 at 12:55
Good point.
3. September 2020 at 15:20
I enjoyed this post.
David Beckworth recently posted that real and nominal interest rates have been going down for about 500 years.
So perhaps zero interest is The New Normal. (Ben Bernanke refers to this as chronic capital gluts. This makes sense; as economies become more advanced they can generate “excess” income or capital. And today the Federal Reserve and the US operate in globalized capital markets).
This raises the interesting possibility that the Federal Reserve can only target a domestic Inflation Target, or even better, NGDPLT, by implementing negative interest rates and perpetual quantitative easing.
3. September 2020 at 16:05
Does the price of oil matter over the next 10 years (especially the back half when EVs are cheaper to operate than internal combustion engine vehicles)?
3. September 2020 at 20:59
Burgos–EVs deserve a lot more attention. If the solid state batteries work, we are looking at cars that could last a million miles and be cheaper to operate all along the way, while polluting the air less.
OT
https://marginalrevolution.com/marginalrevolution/2020/09/on-vaccine-timing-from-the-comments.html
See above, macroeconomists are proving themselves almost worthless in this latest recession, yet it seems to me they should devote their perspectives to the cost-benefit advantages of introducing a C19 vaccine earlier rather than later.
Trump is pushing to introduce the vaccine earlier, and no doubt will be pilloried for his efforts, as Trump is always bad.
But the real question is, is Trump aggressive enough?
4. September 2020 at 05:42
re: “Even today, there are still economists out there who believe that fiscal policy drives inflation”
Amen.
Re: “won’t be due to a negative AD shock—as inflation expectations are rising significantly:
The rate-of-change in short-term money flows, proxy for real output, doesn’t end until the beginning of May 2021.
4. September 2020 at 06:23
Scott Sumner’s Monkey’s Paw
1. Massive AD shock from COVID
2. Learning from Scott, Fed responds in unprecedented fashion.
3. Economy recovers more quickly than expected, due to effective Fed intervention
4. Trump is re-elected
Maybe Scott didn’t CAUSE Trump’s re-election, but it wouldn’t have happened without Scott’s teachings.
4. September 2020 at 06:31
re Beckworth: “These bond investors are missing the point of AIT: it helps the Fed avoid mistakes like the 2015-2018 rate hikes. Avoiding them (and the 2014 talking up of rate hikes that helped push up the dollar) probably would’ve meant higher inflation.”
The top in Brent crude oil was on 2/8/13 @ $118.90. The bottom was on 1/20/16 @ $26.01. Long-term money flows peaked in Jan 2013 and bottomed in Dec 2015 (i.e., long-term monetary flows, volume times transactions’ velocity, fell by 80% during the same period).
Thus, my prediction for the bottom in oil was (which Tyler Durden got completely wrong).
“Lags are constants but “K” is not. K is the reciprocal of Vt. The bottom isn’t Dec. but Jan. (like last year)” Sep 24, 2015. 11:56 AM
I.e., the distributed lag effect of money flows have been mathematical constants for > 100 years. So whey doesn’t the FED use monetarists’ tools? Monetarists know that it is impossible to control properly the money supply through the manipulation of interest rates.
4. September 2020 at 06:45
Just as the G.6 Debit and Demand Deposit Turnover release was discontinued at the time it was needed (at the start of the housing boom), so too is the interim final rule which “reduces reserve requirement ratios for all depository institutions to zero percent.”
Anyone that doesn’t understand the ramifications is no economist.
The money stock (and DFI credit, where: loans + investments = deposits), can never be managed by any attempt to control the cost of credit, R *, or Wicksellian: equilibrium/differential real rates, [or thru a series of temporary stair stepping or cascading pegging of policy rates on “eligible collateral”; or thru “spreads”, “floors”, “ceilings”, “corridors”, “brackets”, IOeR, or BOJ-yield curve type control, YCC, of JGBs, etc.].
4. September 2020 at 06:45
Spencer, if I remember right, in the Midas Paradox Scott argues strongly against the notion of long logs. Especially long and variable lags.
Liquid capital markets responds almost immediately to new information. Commonly they even anticipate monetary policy. That’s just the opposite of a lag.
4. September 2020 at 06:49
Why did Bankrupt-u-Bernanke fail? The rate-of-change in required reserves, proxy for inflation, dropped (at a negative rate of change) for 29 consecutive months.
To Spencer Hall
From: Richard.G.Anderson@stls.frb.org
Sent: Thu 11/16/06 9:55 AM
To: Spencer Hall (sbh_home@hotmail.com)
Spencer, this is an interesting idea. Since no one in the Fed tracks reserves, such a coincidence in the data perhaps confirms that the Fed funds rate settings have been correct. [sic]
4. September 2020 at 06:53
Using required reserve figures, we knew the precise “Minskey Moment” of the GFC:
POSTED: Dec 13 2007 06:55 PM |
The Commerce Department said retail sales in Oct 2007 increased by 1.2% over Oct 2006, & up a huge 6.3% from Nov 2006.
10/1/2007,,,,,,,-0.47 * temporary bottom
11/1/2007,,,,,,, 0.14
12/1/2007,,,,,,, 0.44
01/1/2008,,,,,,, 0.59
02/1/2008,,,,,,, 0.45
03/1/2008,,,,,,, 0.06
04/1/2008,,,,,,, 0.04
05/1/2008,,,,,,, 0.09
06/1/2008,,,,,,, 0.20
07/1/2008,,,,,,, 0.32
08/1/2008,,,,,,, 0.15
09/1/2008,,,,,,, 0.00
10/1/2008,,,,,, -0.20 * possible recession
11/1/2008,,,,,, -0.10 * possible recession
12/1/2008,,,,,,, 0.10 * possible recession
RoC trajectory as predicted.
4. September 2020 at 07:10
@Matthias Goergens
re: “That’s just the opposite of a lag.”
If it’s the opposite, then I couldn’t predict that the beginning of May next year will result in an economic downturn (barring no further stimulus).
Any injection by definition adds to any existing lag. M*Vt serves as a “guide-post” for N-gDp trajectories. N-gDp is determined by the volume of goods and services coming on the market relative to the actual, transactions’ flow of money.
Roc’s in R-gDp serves as a close proxy to Roc’s in total physical transactions, T, that finance both goods and services. Then Roc’s in P, represents the price level, or various Roc’s in a group of prices and indices.
Monetary flows’ propagation is a mathematically robust sequence of numbers (sigma Σ), neither neutral nor opaque, which pre-determine macro-economic momentum (the → “arrow of time” or “directionally sensitive time-frequency de-compositions”).
For short-term money flows, the proxy for real-output, R-gDp, it’s the rate of accumulation, a posteriori, that adds incrementally and immediately to its running total.
Its economic impact is defined by its rate-of-change, Δ “change in”. The Roc is the pace at which a variable changes, Δ, over that specific lag’s established periodicity.
4. September 2020 at 07:14
A good way to look at it would be the “real money gap”, the gap between the rate of money creation and the rate of inflation. That gap would close by May next year.
4. September 2020 at 07:28
re: ” the Midas Paradox Scott argues strongly against the notion of long lags”
Make no mistake, this 2020 monetary injection is an outlier. But the historical evidence, the correlations, are perfect. The lags for both R-gDp and inflation are mathematical constants and have been for over 100 years.
I can prove to you that any given change in direction of the economy is matched precisely with a change in money flows. And these are ex-ante projections, not ex-post regressions. You actually cannot run a regression test against the old data (as the FED covers its ELEPHANT TRACKS). You won’t find any period in which I’m wrong.
4. September 2020 at 07:47
The timing of this market crash is unfortunate for this post, though I think the message here is mostly correct. That said, there could be some utility in massive government spending that forces the Fed to raise rates, just getting us further from the ZLB. That’s not to say this is a preferred approach. It’s not even close, but could be helpful. Level targeting would be far more efficient.
Krugman tweeted that anyone who claims to know why markets are selling off right now doesn’t know what they’re talking about. I’m not a Nobel winner, or even an economist, but even I can see that NGDP growth expectations are likely falling, as revealed in the 5 year TIPS breakeven, for example.
https://fred.stlouisfed.org/graph/fredgraph.png?g=ve7U
4. September 2020 at 07:54
re: “market crash”
There’s no market crash. It’s a seasonal downswing. The money stock peaked, M1, @ 5,620.1. The latest figure is 5,402.0.
There are 6 seasonal, endogenous, economic inflection points each year. (they may vary a little from year to year):
Pivot ↓ #1 3rd week in Jan.
Pivot ↑ #2 mid Mar.
Pivot ↓ #3 May 5,
Pivot ↑ #4 mid Jun.
Pivot ↓ #5 July 21,
Pivot ↑ #6 2-3 week in Oct.
These seasonal factors are pre-determined by the FRB-NY’s “trading desk” operations, executing the FOMC’s monetary policy directives: in the present case just reserve “smoothing” and “draining” operations,
the oscillating inflows and outflows, the making and or receiving of correspondent and other interbank payments by and large using their “net free” (as opposed to “net borrowed”) excess reserve balances).
Each, and every year, the seasonal factor’s map (economic time series’ cyclical trend), or scientific proof, is demonstrated by the product of money flows, our means-of-payment money times its transaction’s velocity of circulation (the scientific method).
Monetary flows (volume X’s transactions’ velocity) measures money flow’s impact on production, prices, and the economy (as flows are driven by payments: “bank debits”). It is an economic indicator (not necessarily an equity barometer). Double-derivative rates-of-change Δ, in M*Vt = Roc’s Δ in AD, aggregate monetary purchasing power.
4. September 2020 at 07:56
I.e., stocks may not bottom until (without additional stimulus):
Pivot ↑ #6 2-3 week in Oct.
4. September 2020 at 08:00
As I said:
The DJIA is down 189 at present. This break should be sold.
Aug 31, 2020. 10:55 AMLink
4. September 2020 at 08:26
Michael, You said:
“The timing of this market crash is unfortunate for this post”
Don’t confuse the stock market with the economy. When stocks boomed in August it didn’t mean the economy was booming, and vice versa for September.
The 5 year TIPS breakeven is 1.59%, not much different from a couple days ago.
4. September 2020 at 09:15
I have often said I am slow on the uptake re monetary policy. True. But today it just clicked re: monetary offset—finally got it. How is that not known—or at least recognized and tried to be refuted in some other way? Are these economists, or “market commenters”?
Re: Powell. He has said he is targeting 10 year PCE at 2%—and in a way that any look back period should be as close as possible to that number. And you have said if the PCE Index is not 135 in 10 years he will have failed. I guess that is true.
But he is off to a bad start. The 10 year nominal yield 10 years forward (or 10 years after the next 10 years) is 2%. If he wants to accomplish what he says he does, don’t you do “whatever it takes” as soon as possible?
4. September 2020 at 09:28
Scott,
I think I do okay translating changes in major stock indexes into changes in NGDP growth expectations and vice versa. At today’s S&P 500 low(down about 8% in 3 days), long run NGDP growth expectations were down a about .3% over the past few days. This is consistent with the biggest drop in 5 year forward inflation expectations in months.
Do I think lack of fiscal spending is a big factor? No, though Keynesians might point to sinking prospects for more near-term fiscal support.
I think we’re in a dangerous time for the stock market in the short-run right now, because we have a somewhat new monetary regime, and traders are more likely to misinterpret Fed intentions. I think this was a major factor in the 1987 stock market crash.
By the way, I extended my deterministic model for translating changes in GDP growth expectations to changes in stock indexes to individual stocks, via some simple applied statistics. So, this depends heavily on the correlation between changes in the S&P 500 and individual stock prices, which actually covers most individual stocks well. Exceptions are really fast growing companies like Tesla, with low correlations recently with the broader market. Even in that case though, the bigger the move in the indexes, the higher the correlation with individual stocks, so the approach is more accurate, the larger the nominal shock.
The head of portfolio stress-testing at one of the largest distributors of data services to the banking and brokerage industry has had a lot of kind things to say about the technology as I pursue the opportunity to sell it to the company.
http://www.exactmacro.com has information about the demo software I developed as part of a larger investor dashboard I’m working on.
4. September 2020 at 09:41
Michael, You said:
“I think I do okay translating changes in major stock indexes into changes in NGDP growth expectations and vice versa. At today’s S&P 500 low(down about 8% in 3 days), long run NGDP growth expectations were down a about .3% over the past few days. This is consistent with the biggest drop in 5 year forward inflation expectations in months.”
Actually, the 5 year TIPS spread is at 1.60%, about the same as two days ago, before the stock crash.
4. September 2020 at 10:43
Re: “I think this was a major factor in the 1987 stock market crash.”
And you think “I do okay translating changes in major stock indexes into changes in NGDP growth expectations”
Hogwash. 1987 was the litmus test for Central Bank stupidity (no Nassim Nicholas Taleb black swan).
Monetary flows (volume X’s velocity), fell from 16 in AUG, to 4 in NOV (See G.6 release – debit and demand deposit turnover). [ Δ, not Δ Δ ] Note, money flows, bank debits (money actually exchanging counter-parties), turned negative during the S&L crisis.
http://bit.ly/16Otfw9
Conterminously (3 months prior to the crash), the rate-of-change in RRs (the proxy for R-gDp), was surgically sharp, decelerating faster than in any prior period since the series was first published in January 1918. The proxy declined from 11 in JUL to (-)4 in OCT. [ Δ, not Δ Δ ]
Accompanying this sharp deceleration in the RoC for M*Vt (proxy for all transactions in American Yale Professor Irving Fisher’s truistic: “equation of exchange”, the monetary authority mis-judged macro-economic strength (like the last half of 2008), and on Sept. 4 the FOMC raised (1) the discount rate, which was not yet a penalty rate, 1/2 percent to 6%, & (2) the policy FFR 1/2 percent to 7.25% (up from 5.875% in Jan).
Black Monday began when the target FFR was increased to 6.5% on 9/4/1987. The effective FFR began to trade above the policy rate c. 9/22/1987 (constrained by reserve demand). The effective FFR spiked on Thursday (the very first day of the reserve maintenance period).
On Sept. 30 the effective FFR spiked at 8.38%; fell to 7.30% by Oct. 7; then rose to back to 7.61% Oct 19 (Black Monday). Thus, the effective FFR spiked 36 basis points higher than the FOMC’s official target, it’s policy rate on “Black Monday”.
The shortfall in the quantity of legal reserves supplied by the FRB-NY’s trading desk (which had already dropped at a rate not exceeded at any time since the Great Depression) bottomed with the bi-weekly period ending 10/21/87. This was the trigger. However, the Fed covers: The Nattering Naybob’s “Elephant Tracks”. So you can’t run a regression against the historical time series.
At the same time, the 30 year conventional mortgage yielded 11.26%, up from 8.49% in Jan. 87, & Moody’s 30 year AAA corporate bonds yielded 11.06% on 10/19/87, up from 9.37% in Jan. 87.
The preceding tight monetary policy (monetary policy blunder), i.e., the sharp reduction in legal reserves (mirroring the absolute decline in our means-of-payment money), had effectively forced all rates up along the yield curve in the short-run (when inflation and R-gDp were already markedly subsiding). I.e., interest is the price of loan funds, the price of money is the reciprocal of the price level.
Note: interest rates may either rise or fall during the short-run, in response to the FOMC tightening policy, depending upon the “arrow of time”, and the monetary fulcrum (the thrust of inflation).
On 10/19/87 the CBs had to scramble for reserves (too stringently supplied relative to demand) at the end of their maintenance period (bank squaring day), to support their loans-deposits (it is noteworthy that contemporaneous reserve requirements were then in effect exacerbating the shortfall & response time).
A significant number of banks, with large reserve deficiencies, tried to settle their legal reserve maintenance contractual obligations at the last moment. But the FRB-NY’s “trading desk” failed to accommodate the liquidity needs in the money market – until it was already way too late (i.e., ignored their perversely coveted interest rate transmission mechanism).
I.e., it was a major monetary policy blunder by the Maestro, Chairman Alan Greenspan
4. September 2020 at 10:49
Scott,
I might have been sloppy, but I was looking at the 5 year break even and forward inflation rates:
https://fred.stlouisfed.org/graph/fredgraph.png?g=veBk
Sloppy, because Beckworth posted a tweet today with the liquidity-adjusted 5 year forward rate being flat.
4. September 2020 at 10:51
Spencer B Hall,
I think you misunderstand the point I was making. I think the Fed largely caused the ’87 crash, and I think part of it was a misunderstanding of Greenspan, due to miscommunication, among other things. I think these problems are more likely to occur when there’s been a change in monetary regime.
4. September 2020 at 17:00
@Michael Sandifer
There was no excuse for what Greenspan did. His errors were egregious. And there’s no excuse for the economic nonsense since 1961.
Banks don’t loan out deposits. All bank held savings are frozen. This is the sole source of Alvin Hansen’s 1938 secular stagnation thesis since 1981 (the apex in deposit innovation, the end of gate keeping restrictions on bank deposits).
Any institution whose liabilities can be transferred on demand, without notice, & without income penalty, via negotiable credit instruments (or data pathways), & whose deposits are regarded by the public as money (e.g. E-$ market), can create new money, provided that the institution is not encountering a negative cash flow.
From a system’s belvedere, commercial banks (DFIs), as contrasted to financial intermediaries (non-banks, NBFIs): never loan out, & can’t loan out, existing deposits (saved or otherwise) including existing transaction deposits, or time “savings” deposits, or the owner’s equity, or any liability item.
When DFIs grant loans to, or purchase securities from, the non-bank public, they acquire title to earning assets by initially, the creation of an equal volume of new money (demand deposits) – somewhere in the payment’s system. I.e., commercial bank deposits are the result of lending, not the other way around.
The non-bank public includes every institution (including shadow-banks), the U.S. Treasury, the U.S. Government, State, & other Governmental Jurisdictions, & every person, etc., except the commercial & the Reserve banks.
5. September 2020 at 08:07
Michael, I’m not a fan of those liquidity adjusted estimates.
5. September 2020 at 13:12
Spencer B. Hall,
You’ve obviously studied the ’87 situation in much more detail than I have. My conclusion was based on public statements Greenspan made in the context of a real shock being created by James Baker’s very ignorant public comments about Japan supposedly devaluing the Yen to get an unfair trade advantage and threats he was making toward Japan.
Greenspan was a new Fed chair and he was continuing a transition out of the late 60s-early 80s regime that the Volker FOMC began. Markets misjudged Greenspan based on his communication prior to and during the crash, as evidenced by the actions Greenspan took to turn the situation around. The nominal shock was much greater than the real shock.
Very few people seem to agree with my admittedly comparatively shallow assessment, but the overwhelming majority of stock index changes are due to changes in expected GDP growth, so I always start there when trying to figure out what caused stock price movements over a given period. Of course, sometimes it’s obvious stock price changes are heavily influenced by non-GDP growth factors, such as changes in corporate or capital gains taxes.
5. September 2020 at 13:14
Oh, and I did take the context of a rate height cycle into account. The Fed always, or nearly always overdoes the rate hikes.
5. September 2020 at 13:16
Scott,
I had a lot less faith in liquid asset markets when I started reading this blog in early 2009. After reading your arguments and looking at the evidence over the years, I now have more respect for liquid asset market pricing than anyone else I know of. I’m more market monetarist than the market monetarists.
5. September 2020 at 13:46
Michael, Not sure what this is directed at. I do believe markets are efficient. The liquidity adjusted price you cite is not a market price. That’s my point.
5. September 2020 at 17:17
Scott,
My last comment there wasn’t referring to liquidity-adjusted prices, but you’ve expressed skepticism in the past regarding the ’87 crash being primarily caused by a nominal shock, for example, and referred to the 90s-to-early 2000s tech run up as “fishy”. Also, I don’t think market monetarists take the relationships between NGDP growth expectations and liquid asset market prices as seriously as I do, i.e. serious enough to try to model it with precision.
And then there are my truly heterodox(perhaps merely amateur) ideas about the structural relationships between interest rates and rates of return on capital and NGDP growth expectations. There are only hints that I’m correct, which certainly aren’t enough to be convincing.
5. September 2020 at 17:19
The main point I’m making though, is, as much as you bang your head against the brick wall of Trump supporters, for example, there are those of us who’ve actually listened over the years and have been influenced.
6. September 2020 at 00:59
Efficient markets?
“The focus on equilibrium and prices is due to the hypothetico-axiomatic method, a.k.a. the deductive methodology. The axioms are postulated that people are individualistic and focus on maximising their own satisfaction (named ‘utility’, in honour of Jeremy Bentham, the first economist to argue for the legalisation of the then banned practice of charging interest; Bentham, 1787). Next, a number of assumptions are made: perfect and symmetric information, complete markets, perfect competition, zero transaction costs, no time constraints, fully flexible and instantaneously adjusting prices. McCloskey (1983) has argued that economics has been using mathematical rhetoric to enhance the impression of operating scientifically. Equilibrium will not obtain, if only one of the axioms and assumptions fails to hold. But their accuracy is not tested. Yet, one can estimate the probability of obtaining equilibrium.
Despite the claims to rigour, the pervasive equilibrium argument and focus on prices reveal a weak grasp of probability mathematics: Since for partial equilibrium in any market, at least the above eight conditions have to be met, if one generously assumed each condition is more likely to hold than not – corresponding to a probability higher than 50%, for instance, 55% – then the probability of equilibrium equals the joint probability of all conditions, which is 0.55 to the power of 8: less than 1%. As the probability of each of the eight conditions being an accurate representation of reality is likely significantly lower than 55% (most having a probability approaching zero themselves), it is apparent that the probability of partial equilibrium in any one market approaches zero (Werner, 2014b). For equilibrium in all markets, these very low probabilities have to be multiplied by each other many times. So we know a priori that partial, let alone general equilibrium cannot be expected in reality. Equilibrium is a theoretical construct unlikely to be observed in practice. This demonstrates that reality is instead characterised by rationed markets. These are not determined by prices, but quantities: In disequilibrium, the short side principle applies: whichever quantity of supply and demand is smaller can be transacted, and the short side has the power to pick and choose with whom to trade (not rarely abusing this market power by extracting ‘rents’, see Werner, 2005).1
Without equilibrium, quantities become more important than prices.”
https://www.sciencedirect.com/science/article/pii/S0921800916307510#bb0295
6. September 2020 at 05:12
Postkey,
First, market efficiency need not depend on any model. It can exist and be shown to exist empirically without being able to explain why markets are efficient.
And my software, for example, helps demonstrate that broad stock indexes respond very predictably and precisely to nominal shocks. It models real shocks far less well, but then it isn’t designed to model real shocks. That’s a more complicated challenge. Fortunately for me, most US recessions are mostly the result of relatively large nominal shocks.
Second, I think Milton Friedman addresses the criticism of unrealistic assumptions in economic models well in his “The Methodology of Positive Economics.” This essay introduces Friedman’s principle that assumptions need not be “realistic” to serve as scientific hypotheses. They only need to make significant predictions.
Third, I think the mathematical approach taken in your comments to assess the joint probability of assumptions being correct is wrong, and anyway, large liquid asset markets like US stock markets obviously meet the assumptions you mention extremely well.
Fourth, in the paper you cite from Werner, it begins with a patently incorrect statement about interest being the price of money. It isn’t. Interest is the price of credit. The price of money is related to nominal economic output. That’s one of the central market monetarist claims. The value of a unit of the medium of exchange is $1/NPV of current and future NGDP, in the simplest conception. From the market monetarist perspective, get that wrong, and the whole model that follows is hopelessly flawed.
Then, Werner goes on to claim that higher interest rates are associated with higher economic growth, as of he’s discovered a new principle, when that’s exactly what market monetarists claim. Market monetarists agree that interest rates are the result of changes in the supply of money versus demand, not the cause. That said, for the purpose of ease of communication, I say that to properly stimulate the economy, one needs to engage in a monetary policy that leads to low enough short-term rates to raise long-term rates consistent with the long run NGDP growth path, to the degree wages haven’t adjusted, making such a sustainae return to the trend path impossible.
6. September 2020 at 05:36
Postkey,
I should be specific and say that the joint probability math you use is wrong, because it suggests that if even one assumption in formally modeling efficient markets is completely unsupported, then none are supported, and that obviously isn’t true. And anyway, problems with some micro transactions don’t necessarily lead to problems with macro pricing. It’s important to avoid fallacies of composition.
6. September 2020 at 05:40
Or, better to say, the claim is that if one assumption doesn’t hold at all, then markets aren’t efficient, she that isn’t true.
6. September 2020 at 13:15
Shouldn’t TIPS be at least back at the pre-financial crisis levels ~ 2.5%? I say “at least” because we were not suffering any supply shock at the time.