Archive for February 2015


Long and variable leads (a reply to Tony Yates)

Tony Yates expresses shock that someone calling himself a market monetarist could reject Milton Friedman’s famous “long and variable lags” claim about monetary policy.

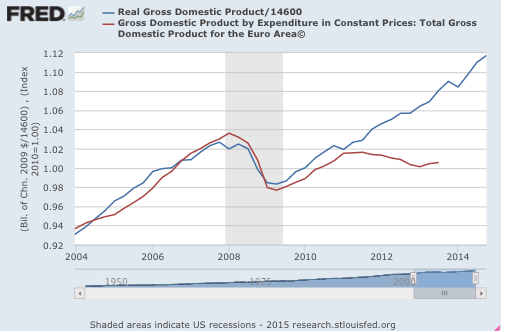
I have great respect for Friedman, but when I did my research on monetary policy in the interwar years (which is the period where it is easiest to clearly identify monetary shocks) I wasn’t able to find significant lags.   The monthly WPI and industrial production indices seemed to move almost immediately and sharply after monetary shocks.  If NGDP data had been available, it would have also responded quickly.

Even worse, I found that Friedman and Schwartz had misidentified monetary shocks by focusing on the monetary aggregates, which often moved ahead of or behind the actual shock.  Thus the devaluation that occurred in April 1933 led to expectations of future money growth, and these expectations led to an immediate surge in prices and output. That’s what led me to coin the “long and variable leads” phrase.  I thought it would be obvious to people that I know that classical theories of causation don’t really allow for cause to follow effect.  Rather that it is actually expectations of future money growth that caused the near term NGDP growth surge.  I used a bit of poetic license to drive the point home.

Later I learned that Woodford and Eggertsson were doing similar research from a New Keynesian perspective.  Here’s Yates:

Sumner cites Woodford and Krugman as commenting on the potency of expectations, and uses this in support of his thesis that changing expectations changing things refutes the long and variable lags thesis.  But I am quite sure neither of them believe any such thing.  Estimated versions of Woodford’s model (for example, the original Rotemberg-Woodford model) behave just like my account above.  And Krugman is a firm believer in sticky prices, talking interchangeably between IS/LM and New Keynesian models.  Which behave just as I’ve explained above.

The only model I know where monetary policy has its entire effect instantaneously is the flexible price rational expectations monetary model.  And in this case there is no point in monetary stabilisation policy at all.  Money has no short-run effects on output.  Optimal policy in this model is to set rates at zero permanently, obeying the Friedman Rule.  If there are real frictions in this model, like financial frictions, there will still be a role for fiscal stabilisation, however.

I’m sure these mix-ups would get ironed out if MaMos stopped blogging and chucking words about, and got down to building and simulating quantitative models.  Talking of which….

Lots of problems here:

1.  Obviously I’m a believer in sticky wage/price models, and hence do not believe that monetary policy has an instantaneous effect on all prices (although it does instantly impact the prices of commodities traded in auction-style markets.)  So Yates has mischaracterized my views.

2.  When Woodford’s coauthor Gauti Eggertsson tried to apply their approach to the Great Depression, he read a great deal of my empirical work, and seemed to like it. Eggertsson’s 2008 AER paper on monetary policy expectations in 1933 cites three of my empirical studies.  That doesn’t mean he agrees with all my views, but he didn’t seem to find them ridiculous. And in 1993 I published a paper arguing that temporary currency injections would not be inflationary, 5 years before Krugman published “It’s Baaack . . .”

3.  I can’t speak for all market monetarists, but I’m extremely skeptical of the VAR modeling approach discussed by Yates.  The early attempts at VAR models produced a “price puzzle,” which meant that tight money seemed to “cause” higher inflation.  I remember thinking “Yeah, what do you expect when you use interest rates as an indicator of the stance of monetary policy.”  Yes, some of these problems have been “fixed”, but I’m not impressed by the fact that 99% of the economics profession seemed to think monetary policy was “easy” during 2008-09.

In my view economists should forget about “building and simulating quantitative models” of the macroeconomy, which are then used for policy determination. Instead we need to encourage the government to create and subsidize trading in NGDP futures markets (more precisely prediction markets) and then use 12-month forward NGDP futures prices as the indicator of the stance of policy, and even better the intermediate target of policy.  It’s a scandal that these markets have not been created and subsidized, and it’s a scandal that the famous macroeconomists out there have not loudly insisted that it needs to be done.

If and when we get out of the Stone Age and have highly liquid NGDP and RGDP futures markets, then it would be much easier to explain my views on leads and lags. In that world a change in NGDP futures prices, not a change in the fed funds rate, represents a change in monetary policy. To be more specific:

I predict that whenever the 12-month forward NGDP futures prices starts falling significantly, near term NGDP would fall at about the same time, or soon after.  For instance, if we had had a NGDP futures market in 2008, then during the second half of the year you would have seen a sharp fall in 12 month forward NGDP futures.  At roughly the same time or soon afterwards current NGDP would have been falling. In contrast, if the Fed had moved aggressively enough to prevent 12-month forward NGDP prices from falling, then near term NGDP in late 2008 would have been far more stable.  I think that’s roughly consistent with Woodford’s view, although we may differ slightly on the lag between a change in 12-month forward NGDP expectations and a change in actual NGDP.  (Nor would he necessarily accept my views on the potency of monetary policy in 2008.)

PS.  The post also speculates on my views on fiscal policy.  Just to be clear, I oppose attempts to force a balanced budget.

PPS.  Yates’s blog is entitled “Longandvariable.”  Not the specific post, the entire blog. He just needs to add “leads.”

PPPS.  Yates refers to me as a “MaMoist.”  I guess that’s better than being a Maoist, like that faction in the Greek party Syriza.  You know, the party so many on the left now seem enamored with.  The one that has a bunch of MPs that idolize history’s greatest mass murderer.

HT:  Marcus Nunes


It turns out that the US was never at the zero bound

Matt Yglesias has a very interesting new post:

Something really weird is happening in Europe. Interest rates on a range of debt “” mostly government bonds from countries like Denmark, Switzerland, and Germany but also corporate bonds from Nestlé and, briefly, Shell “” have gone negative. And not just negative in fancy inflation-adjusted terms like US government debt. It’s just negative. As in you give the German government some euros, and over time the German government gives you back less money than you gave it.

In my experience, ordinary people are not especially excited about this. But among finance and economic types, I promise you that it’s a huge deal “” the economics equivalent of stumbling into a huge scientific discovery entirely by accident.

Indeed, the interest rate situation in Europe is so strange that until quite recently, it was thought to be entirely impossible. There was a lot of economic theory built around the problem of the Zero Lower Bound “” the impossibility of sustained negative interest rates. Some economists wanted to eliminate paper money to eliminate the lower bound problem. Paul Krugman wrote a lot of columns about it. One of them said “the zero lower bound isn’t a theory, it’s a fact, and it’s a fact that we’ve been facing for five years now.”

And yet it seems the impossible has happened.

If I wanted to quibble I’d say Yglesias slightly exaggerates the element of surprise here. Some of us knew that US T-bill yields fell a couple of basis points below zero around 1939-40.  But on the bigger issue he’s right.  I never would have expected negative 0.75% nominal interest rates.  In retrospect, I underestimated the cost of storing large quantities of cash.  I’d guess it’s much higher than 100 years ago, when banks routinely dealt with large quantities of gold, and currency notes with denominations as large as $100,000.

And most other economists were even further off base.  Indeed back in 2009 I used the cost of storing cash as an argument in favor of negative IOR, and some Keynesians disagreed with me.  They said negative IOR would merely cause ERs to transform into safety deposit boxes full of currency.  I said the American public didn’t want to store trillions of dollars in currency and coins.  There’d be at least a modest hot potato effect.

As Matt points out, the key takeaway is that the US was never at the zero bound:

The big one is that central banks, including the United States’, may want to consider being bolder with their interest rate moves. For years now, the Federal Reserve’s position has been that it “can’t” cut interest rates any lower because of the zero bound. Instead, it’s tried various things around communications and quantitative easing. But maybe interest rates could go lower? Unlike the European Central Bank, the Federal Reserve pays a small positive interest rate on excess reserves. Fed officials normally say this doesn’t make a difference in practice, but it looks like negative rates on excess reserves may be the key to negative bond rates.

It’s no longer an issue of “just 25 basis points.”  German 5-year bond yields are currently negative, which is considerably lower than the 0.60% that they bottomed out at in America.  If we were never at the zero bound, then the foes of market monetarism have pretty much lost their only good argument for fiscal stimulus.

Now for the curve ball.  I am not saying the Fed should have tried to replicate the negative 5-year bond yields of Germany.  I view negative long term bond yields not as an expansionary monetary policy, but rather as a sign of failure.  Never reason from a bond yield.  A truly expansionary monetary policy might well have raised long-term bond yields.  My claim is different.  I’m saying that for those who do think nominal interest rates are a good indicator of the stance of monetary policy, it’s now clear that the Fed could have cut rates much more sharply.

But that’s not why I believe the Fed was never out of ammunition.  I relied on an entirely different reasoning process.  I noticed that Ben Bernanke never once suggested that the Fed had run out of paper and green ink.

The dog that did not bark

Tyler Cowen has a new post offering opinions on a wide range of issues.  In many cases I agree with his views.  For instance, this one:

5. We are still in the great stagnation, for the most part.  But with nominal gdp well, well above its pre-crash peak, it is not demand-based “secular stagnation.”  It just isn’t, I don’t know how else to put it.  And the liquidity trap is still irrelevant and has been since about 2009.

The reasoning used is not very persuasive.  Could you imagine him making that argument in late 1982, when NGDP was above the pre-recession peak?  But Tyler’s conclusion seems sound.

However I take issue with this claim:

4. During the upward phase of the recovery, monetary policy just doesn’t matter that much.

I can’t even imagine what a model would look like where that claim was true.  To see why it is not true, compare the post mid-2009 recoveries in the US and Europe. If monetary policy in the US and Europe did not matter very much during the recovery, then the tightening of monetary policy in mid-2011 in the eurozone ought to have had little effect.  What does it look like to you?

Screen Shot 2015-02-25 at 8.32.42 AM

I think the problem here is that the US recovery looks fairly smooth, and also disappointing, despite various actions by the Fed.  It’s tempting to conclude that Fed policy didn’t matter very much.  But all you have to do is to look across the pond and you’ll see that it mattered a great deal.

PS.  I’m not sure why the Fred’s eurozone RGDP data is not updated.  I believe there’s been a very anemic recovery in the past year.

Update:  Marcus Nunes has updated the graph.  David Beckworth also has a post, which takes a deeper look at the US/eurozone divergence.

Beware of income inequality data

A few years back I got so exasperated reading a Journal of Economic Perspectives piece on income inequality (by Emmanuel Saez and Peter Diamond) that I did a post calling it “propaganda.”  I probably shouldn’t have used that term, but I was reminded of my frustration when reading a very good Alphaville post by Cardiff Garcia:

The issue of whether US inequality has climbed since the recession of 2008 has been relitigated this week. A short analysis by Stephen Rose claimed that income inequality had actually fallen, assigning the credit to public policy.

David Leonhardt of the New York Times discussed Rose’s findings, followed by further analyses and critiques from Ben Walsh and Nick Bunker. I’ll present the findings first before adding my own thoughts at the end.

Mainly in response to the heavily cited claim by Emmanuel Saez that 95 per cent of the income gains in this recovery have gone to the top 1 per cent of earners, Rose emphasizes a couple of broad points.

There are two problems with the 95% claim, one has already been discussed by David Henderson, while the other is often overlooked.  David pointed out that when evaluating income equality you want to remove cyclical effects, as it’s a long term problem.  It’s not unusual for the share of income going to the rich to fall during recessions (as capital gains plunge), and then rise during expansions.  It would make more sense to compare 2014 to a year with similar unemployment, say 2004.

The less often discussed problem is that talking about shares of growth can be very misleading, especially when growth is slow. I’m going to give an extreme example, just to make the point more obvious.

Suppose nominal income and the CPI rose at roughly the same rate between 2004 and 2014.  In that case real income would be roughly unchanged.  But let’s also suppose it wasn’t completely unchanged, just roughly unchanged. More specifically, assume real income rose from $15,000,000,000,000 to $15,000,000,010,000.  That is, real income rose by $10,000.

Let’s suppose that in 2004 Ray Lopez worked at a car wash in LA, making $10,000/year.  In 2014 he had two car wash jobs, and was working much harder. Assume his real income had risen to $18,000.

Now here’s my question:  Is it accurate to say that between 2004 and 2014, 80% of the entire the gain in real income for the United States of America went to Ray Lopez, car washer in LA?  You’re damn right it’s accurate!  And I’m willing to assume that the cited claim by Saez is also accurate.

But there’s another question that goes beyond accuracy; is it misleading?  To me it’s obviously misleading to say that one car washer in LA received 80% of all the real income gains in America, even if my hypothetical data were true. That’s because one could say the same thing about his cousin, if she had gone from doing one house cleaning job to two, with the same $8000 gain in real income.  Indeed I would have earned more than 100% of all real income gains, as my real income rose by more than $10,000 over that decade.  Any time an aggregate doesn’t change very much, but there are significant changes to the components within that aggregate, there are lots of ways of slicing up the data to create misleading impressions. Presenting data that way may not be propoganda, but it certainly does more to confuse than enlighten.

Why Switzerland is such a great country (all’s well that ends well)

The Swiss National Bank did a very foolish thing last month.  No, it was not foolish to stop pegging their currency to the euro.  Fixed exchange rates are a bad idea. Central banks should target macro aggregates.  Instead, the mistake was in letting the Swiss franc (SF) suddenly appreciate by 15% to 18% against the dollar and euro, at a time when Switzerland was experiencing mild deflation.  There were two explanations offered, both completely bogus:

1.  They feared the euro would depreciate sharply because of QE.  Actually the EMH says it’s impossible to predict high frequency currency moves, or alternatively changes in real exchange rates, and hence the SNB was foolish to make that assumption.

2.  They feared they’d have to buy lots of foreign assets to maintain the peg, leading to a larger balance sheet.  But if it’s a small balance sheet you want then you don’t end the peg with a sharp revaluation, which just makes the SF even more attractive.  You end it by devaluing your currency, to make it less attractive.  They got things exactly backwards.

The good thing about the Swiss is that they are sensible people, and have mostly undone the damage of that foolish decision.  The first thing they did is to start trying to depreciate the Swiss franc by buying foreign assets.  Wait a minute, wasn’t that what they were (supposedly) trying to avoid doing by ending the peg? Yes, and it didn’t work.  They were right back in the same mess as in mid-2011, before the peg.

The following graph shows that the SF has fallen from rough parity with the euro after the de-pegging, to about 1.08 SF to the euro today:

Screen Shot 2015-02-23 at 5.18.21 PM

And this graph shows that the Swiss stock market, which crashed on the decision that some claimed was “inevitable” (hint, markets NEVER crash on news that is inevitable), has regained most of its losses.

Screen Shot 2015-02-23 at 5.20.17 PM
Indeed the recovery is even a bit more impressive than the recent fall in the SF. Why is that?

Obviously it’s partly because global markets have rallied with the Greece agreement. But it also reflects the recent fall in the euro against the US dollar. When the Swiss first pegged to the euro in September 2011 it traded at about $1.35 to $1.40/euro.  It was still in that range in the first half of 2014. Today the euro trades at $1.13/euro. That means the SF has actually depreciated against the dollar in recent years.  In trade-weighted terms the SF is probably up slightly, but less than the euro/SF exchange rate might suggest, and indeed far less than even a month ago.  Here is the value of the dollar in terms of SF.

Screen Shot 2015-02-23 at 5.51.19 PM

Given that the Swiss economy was doing fine a year ago at a euro/SF exchange rate about 10% lower than today and a dollar/SF exchange rate about 5% higher, it’s not surprising that stocks have recovered much of their losses, although they remain modestly below the levels of right before the float.

When the Swiss made this foolish decision I suggested that a revaluation of something like 5% might be defensible, but not the 15% to 18% revaluation that actually occurred.  I’m pleased that the Swiss National Bank has seen the light, and that Switzerland has preserved its reputation as one of the best-run economies in the world.

Now they just need to nudge the SF a bit lower, and they’ll be fine.