Archive for April 2014


Doing more with less

There’s been a lot of discussion about the impact of Abenomics.  I’ve been sort of a moderate on the issue, arguing that it helped, but isn’t going to have a transformative impact.  Recently I ran across a piece of data that made me slightly more optimistic about Japan:

The number of people in the world’s third-largest economy dropped by 0.17 percent or 217,000 people, to 127,298,000 as of last Oct. 1, the data said. This figure includes long-staying foreigners.

The number of people aged 65 or over rose by 1.1 million to 31.9 million, accounting for 25.1 percent of the population, it said.

.  .  .

Meanwhile, the country’s main working population aged 15 to 64 fell below 80 million as of Oct. 1, for the first time in 32 years due to the country’s rapidly aging society, according to the government data.

Of the total, the workforce stood at 79,010,000, down 1,165,000.

A 0.17% population decline is modest, but that last line caught my attention. That’s a 1.45% decline in a single year!  If you are lazy and just read headlines you might notice that Japanese RGDP rose 1.7% last year.  But just as in the US, year-over-year figures are misleading.  The Q4 over Q4 figures are about 2.5% RGDP growth, almost the same as the US.

But the US working age population rose by . . . actually I can’t find the data anywhere, so I guesstimated by interpolating between 2008-2010 growth rates, and 2015-2020 forecasts.  The working age population was forecast to rise by about 5 million or 2.5% between 2010 and 2015.  So let’s say about 0.5% per year.  BTW, the Census forecasts show the rate slowing sharply, from 0.9%/year around 2008 to 0.25%/year between 2015-20.  Expect very slow RGDP growth ahead.

The Japanese RGDP figures show growth of nearly 4% per working age adult, which would be equivalent to a 4.5% RGDP growth rate in the US.  That makes me a bit more optimistic about Abenomics.

Two reasons for caution:

1.  Japanese figures are erratic; I expect slightly slower growth this year.

2.  It’s not clear the working age population is the right metric, especially if increasing numbers of Japanese elderly are working.

However under any reasonable population assumptions the Japanese RGDP figures are more impressive than they look.  Also note that the unemployment rate fell from 4.3% in January 2013 to 3.7% in January 2014, after falling only 0.2% during the previous 12 months.  The 3.6% rate in February 2014 is tied for the lowest rate since the 1990s.  I.e. it equals the lowest rate achieved in the Koizumi boom. Expect to see that mark broken soon.

I believe the Japanese output gap is real, but smaller than many of my fellow demand-siders assume.  The big gain from Abenomics is that it reduces the debt burden, as faster NGDP growth hasn’t raise JGB yields.  If both minus 0.5% and positive 1.5% CPI inflation are compatible with the zero bound on interest rates, what government in its right mind (with a debt of over 200% of GDP) wouldn’t opt for the 1.5% rate?

PS.  While using Google to make sure I spelled Koizumi correctly, I came across an excellent Noah Smith post on the subject:

The fact that the spending cuts and the growth speedup exactly coincide is probably a coincidence (unless the Confidence Fairy lives in Japan and never visits Europe). But the point is, austerity didn’t hurt Japan as much as we might expect, and the 2000-07 boom was definitely not caused by a sudden surge in stimulus spending. So the Koizumi era seems not to have been a Keynesian success story.(Update: Of course, I don’t want to confuse levels with growth rates here. The deficit was at its peak during 2000-2003. The “austerity” I mention was a decrease in the rate of growth of the deficit; the decrease in the deficit didn’t really come until 2004-2007. So it’s conceivable that the large deficits of 2000-2003 “jumpstarted” a recovery, or perhaps acted with a lag. But that leaves the question of why deficits suddenly started working after not seeming to do much in the 90s, in which growth kept falling even though deficits kept rising. And it also leaves the question of why the decrease in deficits in 2004-2007, when the interest rate was still at the ZLB, didn’t noticeably hurt the recovery.)

The update made me think he got complaints from Keynesians that it’s levels that matter, not changes.  Of course now Keynesians are trying to explain away the Osborne boom with exactly the opposite argument.

PPS.  Just to be clear, NGDP data is the best way of testing whether Abenomics boosted AD.  It did. By looking at RGDP data you test the joint hypothesis that it boosted AD, and than AD boosted RGDP.

The British jobs recovery

Over at Econlog I have a new post discussing the German jobs miracle.  The punch line is that both NGDP and wages in Germany behaved in about the same way as in America.  This means that my “musical chairs model” predicts that job creation would also be about the same.  However Germany employment is up 6% over the past 6 years while US employment is down 0.7%.  The mystery is resolved if you look at labor income as a share of NGDP–it did far better in Germany than in the US.

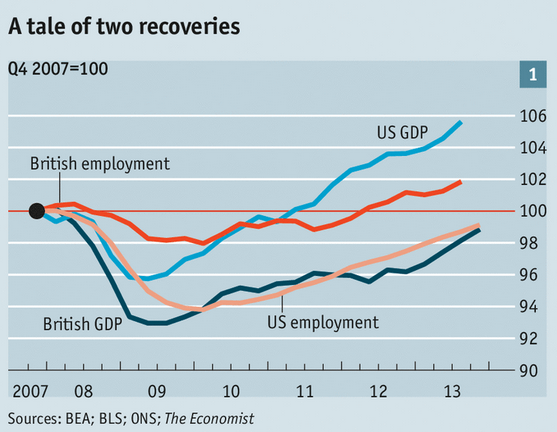
This graph over at Free Exchange made me want to take a look at the British data:

Screen Shot 2014-04-13 at 10.43.55 PM

Notice that US RGDP has risen far faster than British RGDP, and yet Britain has created significantly more jobs.

Here’s some data I collected, 4th quarter of 2007 to 4th quarter of 2013:

Country   —–   United States   Britain

RGDP growth        6.2%         -1.3%

NGDP growth   14.2%16.3%     13.1%

Change in U-rate  +2.2%       +2.1%

Employ. change   -0.7%         +2.5%

Weekly wages      13.6%        10.7%

When considering job creation in the UK, it’s tempting to focus on slow wage growth and/or productivity.  But in a sense the US is the outlier.  I couldn’t find data on the share of GDP going to labor in the UK, but the data I do have (weekly wage growth plus employment growth) indicates that total labor income probably grew by just over 13%, about the same as NGDP.  Thus labor’s share was probably stable.  In contrast, in the US labor’s share of GDP fell by 3.6%, and this largely explains why employment fell, despite NGDP growing a bit faster than weekly wages.

So Germany saw strong wage growth due to a rising share of income going to labor, in the UK employment grew more slowly with a stable share, and in the US employment fell with a declining share of income going to labor.

Is that pattern likely to repeat in future cycles?  I doubt it–it seems more like a coincidence. Something that happened in each country for reasons unrelated to the recession. In my view the keys are still nominal hourly wages and NGDP growth.

Also notice that British NGDP grew a bit faster than German NGDP (which grew 12.8%.)  Thus when Keynesians argue that Germany did better than Britain because of a more expansionary fiscal policy, they are doubly wrong.  First, because Britain ran far bigger deficits than Germany–only with creative accounting (lower GDP implies a smaller cyclically-adjusted deficit) do you get Britain having tighter fiscal policy.  And second, because Britain actually saw faster growth in nominal spending—the UK RGDP shortfall (relative to Germany) was 100% supply-side.  Thus arguing that British AD did worse than German AD due to a less expansionary fiscal policy is absurd, as there is no relative AD shortfall in Britain that needs explanation!

Cowen on Silver on Aaron

Tyler Cowen has an interesting post on baseball, which got a lot of positive reviews in his comment section.  So naturally I will disagree. He responded to a Nate Silver post that claimed Hank Aaron would have been a great baseball player even if all of his homers had been singles. Here’s Tyler:

OK, here is where Lucas comes in.  If Hank Aaron did not carry significant home run potential to the plate, he would have seen a lot more blazing fastballs, pitchers’ “best stuff,” and so on.  Why not challenge the hitter and try to blow it by him if all you are risking is a single up the middle?  As it was, pitchers often threw Aaron a variety of slower curves and off-speed junk, stuff he might grab a piece of with the bat but would have a harder time drilling straight over the fence.

And thus a homer-less version of Aaron probably would have had a harder time making contact at all.  And he certainly would have had many fewer walks.  But yet, with the amazing wrists he had…pitchers were afraid of him.

It is funny how the Lucas critique went from one of the most underrated ideas in economics (pre-Lucas), to one of the most overrated ideas (1980s-early 1990s), and now it is back as one of the most underrated ideas again.

In my view there are two ways of thinking about this thought experiment, and in either case Tyler is wrong:

Assumption 1:

Let’s assume it was the same Hank Aaron, with the same talent, who simply choose to be singles hitter rather than a slugger.  He slapped at the ball.  How would this have impacted his other stats?  Because major league baseball is so competitive, we can assume that most players come close to optimizing.  That means they behave like homo economicus.  There are costs and benefits from swinging harder at the ball. The benefit is more home runs and the cost is more strikeouts.  If there were no costs, then they would all swing harder.  Given that players are mostly optimizing, we can assume that for almost any player there is a tradeoff between more hits (more precisely more OBP) and more power.  That means if Aaron had chosen to hit singles instead of homers he would have had more hits and/or a higher OBP. And this claim fully accounts for the way pitchers would have responded to his strategy shift.

Assumption 2:

I think it’s more likely that Silver had something else in mind.  He was considering a different Hank Aaron, one not capable of hitting homers.  Suppose Aaron had hit 3771 singles instead.  That’s the assumption Silver is using.  Would Aaron still have been great? Silver says yes, and Tyler responds that he would have hit less that 3771 singles, because he would have been pitched to differently.  But that makes no sense, as Silver simply assumed the hit total was 3771.  He didn’t claim the hit total would actually have been 3771 if you change one part of the system but not other parts. That’s the counterfactual—how awesome would someone be with the same number of hits as Aaron but no homers. You can’t respond by saying he would have hit fewer than 3771, because that’s the assumption.

Think of it this way.  Suppose Tyler is right that pitchers would have thrown more fastballs at Aaron if he had been a singles hitter.  Does that mean he could not have had 3771 hits?  Of course not—what it means is that in order to have 3771 hits with the actual pitches thrown to him, he would have had to be capable of producing say 4000 or 4100 with the selection of pitches thrown at the real Hank Aaron. In other words, Silver is considering a 3771 singles equilibrium, allowing for all adjustments in all other areas that would have occurred. It’s a hypothetical, no hitter would ever actually produce 3771 hits and no homers.  Silver is asking how good such a hitter would be, if that far-fetched counterfactual occurred.

I completely agree with Tyler Cowen on the Lucas Critique going from being undervalued to overvalued to undervalued.  I believe the overvaluation resulted from the excessive prestige associated with new classical macroeconomics in the 1980s.  And the recent undervaluation is due to a lack or understanding of how important the Lucas Critique is in non-monetary areas, such as fiscal policy, health care, financial regulation, etc.  And this reflects the fact that many of the most important behavioral changes that occur with policy changes happen in the ultra-long run.  They tend not to show up in time series tests, but do show up cross-sectionally.

BTW, Barry Bonds is clearly the greatest baseball player of all time.  Just saying.

PS.  Which of the following should cause us to “think less” of a player’s career:

1.  A pitcher throws lots of spitballs, which the umps fail to notice.

2.  A lineman in football is cleverly able to disguise the fact that he holds defensive players, and doesn’t get called.

3.  A player uses a banned performance enhancing drug that some other players also use.

4.  A player is the only person in baseball to use a certain legal performance enhancing drug (because other players are unaware of it.)

Paul Krugman on monetary policy options

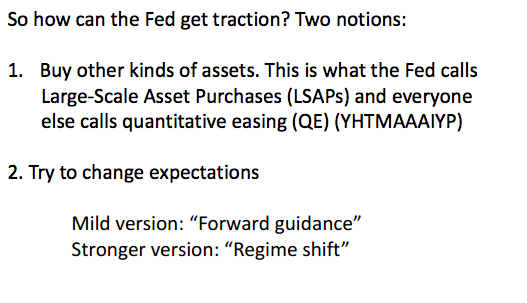
Saturos sent me some interesting PowerPoint slides by Paul Krugman:

Screen Shot 2014-04-11 at 9.37.21 AMKrugman overlooks a third option, targeting an alternative variable that is not subject to the zero lower bound.  Or perhaps he regards that as a regime change.  I can’t be sure.  But it need not involve the Fed changing its inflation/unemployment targets, so it depends how one defines ‘regime.’  I believe he regards “regime shift” as something like an increase in the inflation target to 4%.

In any case, alternative targets include foreign exchange rates, the price of actively traded commodities such as gold, and CPI/NGDP futures prices. Fisher’s Compensated Dollar plan was an adjustable gold price peg, aimed at stabilizing the price level.

In the past I’ve argued that Krugman had a sort of blind spot in this area.  For instance, he was too pessimistic about the ability of the Swiss National Bank to peg the franc at a lower level vs. the euro.  In any case, it’s interesting to compare these schemes to forward guidance. Krugman correctly points out that there is a theoretical possibility of an “expectations trap” with forward guidance.  Markets might not believe central bank promises to fully carry through with monetary stimulus, as the initial effect on expectations is all the central bank really wants and needs.

You can think of the alternatives to interest rate targeting (assets that lack a zero bound) as a way of overcoming the expectations trap. When you target a variable with no zero bound (forex, gold, NGDP futures, etc) you are forced by the market to do “enough” to make the promise credible. Hence no expectations trap. In this post Krugman correctly pointed out that the risk of an expectations trap is replaced with the risk of a central bank balance sheet that is bloated to undesirable levels. In practice, I think that’s unlikely to be a problem for any “reasonable” nominal aggregate policy goal.  And if it does become a problem the market is telling you that perhaps your inflation/NGDP target path is too low.

And we should not overlook the bright side of a bloated balance sheet.  Suppose Japan was still at the zero rate bound after pegging CPI futures at a 2% premium over the spot CPI.  That might imply a bloated BOJ balance sheet.  But that would prove beyond any doubt that the Japanese government had just spent the past 20 walking down a sidewalk covered with $100 bills (or 10,000 yen bills) without once stopping to pick one up.  Not smart, and it’s about time they raised their inflation rate target if they can do so without raising the nominal cost of funding the Japanese debt by one iota.  A free bento box.

Krugman also makes this comment:

Screen Shot 2014-04-11 at 9.51.35 AMOnce again, this is correct but slightly misleading. The distinction between the direct effect of a policy shift and the effect of a shift in the future expected path of policy is almost equally important when not at the zero bound.  Any monetarist thought experiment involving a higher money supply ALWAYS involves the implicit assumption that the increase is permanent, or at least semi-permanent.  Alternatively, when markets react very strongly to changes in the fed funs target (Jan. 2001, Sept. 2007, Dec. 2007) the market reaction almost certainly reflects changes in the expected future path of the fed funds rate, not the current setting.

I was also amused by this; from one of his PP slides:

Screen Shot 2014-04-11 at 9.56.01 AMI wondered what had been deleted from this passage, as there seemed to be missing material at the end of each line.  Here’s where Google is a miracle of the modern world—I was able to find the Wikipedia source:

On September 13, 2012, the Federal Reserve announced a third round of quantitative easing (QE3).[7] This new round of quantitative easing provided for an open-ended commitment to purchase $40 billion agency mortgage-backed securities per month until the labor market improves “substantially”. Some economists believe that Scott Sumner‘s blog[8] on nominal income targeting played a role in popularizing the “wonky, once-eccentric policy” of “unlimited QE”.[9]

Ah, that’s much better!


20% of Americans are in the top 2%

For years I’ve been arguing that income distribution data is meaningless for all sorts of reasons.  One is that it treats capital income and wage income as being equivalent.  A second problem is the life cycle issue—I’ve been in all 5 quintiles at various times in my life, but I’ve never really been anything other than “middle class” in a sociological sense.  (I started middle class and am now upper middle class.)

It seems the press is catching on to this problem:

Fully 20 percent of U.S. adults become rich for parts of their lives, wielding outsize influence on America’s economy and politics. This little-known group may pose the biggest barrier to reducing the nation’s income inequality.

The growing numbers of the U.S. poor have been well documented, but survey data provided to The Associated Press detail the flip side of the record income gap “” the rise of the “new rich.”

Made up largely of older professionals, working married couples and more educated singles, the new rich are those with household income of $250,000 or more at some point during their working lives. That puts them, if sometimes temporarily, in the top 2 percent of earners.

Even outside periods of unusual wealth, members of this group generally hover in the $100,000-plus income range, keeping them in the top 20 percent of earners.

When I sell my rental unit and move to California I’ll have a huge capital gain, and be “rich” that year.  It makes no different whether my real capital gain is zero, the government treats nominal gains as if they are “income,” and economists treat income inequality as if it actually measures “economic inequality.”  The economic inequality debate is still pretty much in the Stone Age. GIGO.

Why does this matter?  Consider all the progressives who wonder “what’s the matter with Kansas?”  (I.e., why are our conservative opponents so stupid?)  Have you noticed that they never ask what’s the matter with Washington, or Massachusetts?  Maybe they should. Here are a couple examples:

1.  Washington state has no income tax at all.  And yet we are constantly told by progressives that “polls show” the public agrees with them. “Polls show” the people say “yes” when asked if it would be nice if the government would provide all sorts of free goodies to everyone. “Polls show” that voters like big government, and think the rich get off too lightly.  So obviously if you had a referendum on replacing Washington state’s regressive Texas-style tax system with an income tax that only applied to the top 1.2% of residents, the liberal voters of Washington state would pass the referendum overwhelmingly.  Or am I missing something?  I guess I am, as in 2010 they rejected the proposal by the razor thin margin of 64% to 36%, despite the Bill Gates fortune bankrolling the “tax the rich” initiative.

2.  Even more liberal Massachusetts has a flat tax with a top rate that is lower that the horribly regressive top rate recently set by the fanatical Tea Party GOP in North Carolina.  Massachusetts is even more liberal than Washington state, with the GOP now almost completely extinct in the State House.  So obviously if there were a referendum to make the income tax progressive, a proposal that would hurt only a “tiny number of taxpayers,” it would pass overwhelmingly, wouldn’t it?  Nope.

There have been five past efforts to amend the constitution to allow for a graduated income tax, but each time””in 1962, ’68, ’72, ’76, and ’94″”ballot referendums to confirm the amendments went down to defeat. All the referendum votes “have failed by wide margins,”

I hesitated to write this post.  I’m actually glad that people who support progressive income taxes are so clueless about both income inequality and politics. It makes it much easier to defeat them politically.

PS.  Marcus Nunes has a wonderful new post that directed me to a left wing blog that advocates intentionally driving the economy into a recession as a way to reduce inequality.  That’s a wonderful idea.  I strongly encourage all progressives to read this Angry Bear post, and adopt the “breaking bones to fix bones” model of the economy.  Voters will love it and that will finally convince them to adopt all your other socialist ideas.

PPS.  I have another post on income inequality over at Econlog.