

The economy is doing fine (as it was 16 months ago)
Lars Christensen is now doing videos at Patreon. Check it out.
Also check out my new post at Econlog, where I express skepticism about whether Japan is a “safe haven”.
So how’s the economy doing over the past 16 months? Here’s RGDP growth:
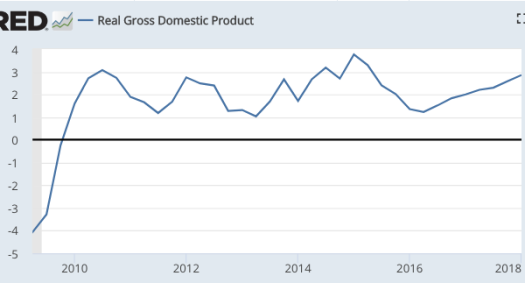 That’s better a bit better than before.
Here’s employment growth (annual % change):
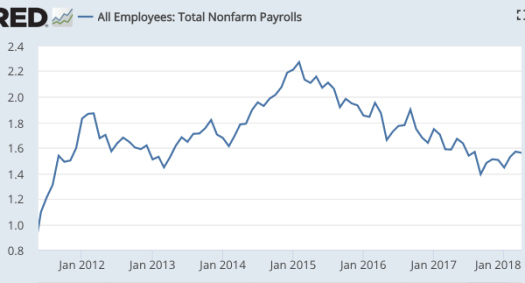 That’s a bit worse than before. Yet the unemployment rate is falling, as it has been for 8 1/2 years.
Here are real wages (deflated by the PCE):
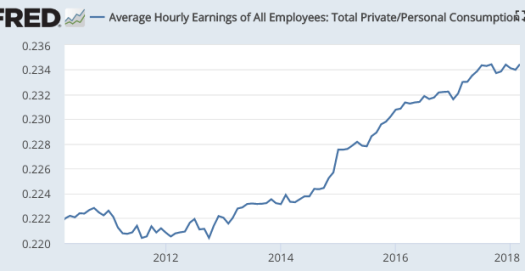 Still rising modestly, as before.
Here is the trade deficit:
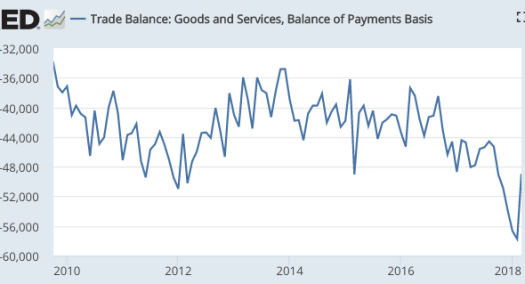
Worse than before, as expected.
Here’s the stock market:
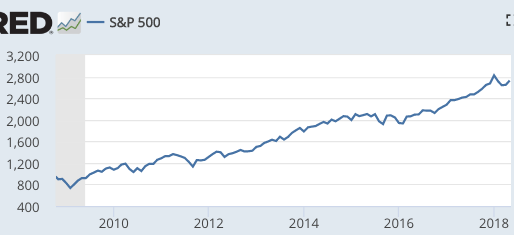
The bull market continues.
Conclusion. We are still in the Obama economy, with the possible exception of RGDP growth, which seems a bit stronger. Otherwise things are about the same.
Prediction: RGDP growth will stay around 3% for a couple more quarters (reflecting the corporate tax cuts and Fed easing), and then fall back below 2%.
Tags:
14. May 2018 at 12:28
– Inflation is understated and therefore (REAL) GDP is overstated.
– And what happens/happened to the “change in debt” ? this is the MOST important metric in ANY economy. (think: Steve Keen).
– And rising interest rates won’t help either.
– Yes, corperate profits will grow but because some 90% of tax cuts benefit the corporate sector it won’t help the economy. It won’t generate more jobs. Because households, workers and families didn’t receive a meaningful payrise.
Off topic: Housing bubble in Australia:
http://www.news.com.au/finance/real-estate/brisbane-qld/southeast-queensland-headed-for-property-bloodbath-expert-warns/news-story/777c6fe9f295023346e455f75580a5b5
14. May 2018 at 12:53
If/when/as growth falls, do you expect the Fed to tighten policy (slow NGDP growth) or accommodate higher inflation? I assume the former, which raises the usual risk of over-tightening at this stage of the cycle. Do you have any faith in the yield curve (1o year yield minus 2 year yield) as a good predictor of whether that is happening? With 10 year yields at 3%, a further 4 or 5 hikes in the FFR could push the curve negative unless 10 year yields rise further in the interim, which they may very well do of course.
14. May 2018 at 13:13
Scott, that off-topic link from Willy2 is interesting. This is one of the points I have been trying to make. The article starts out:
‘BRISBANE’S oversupplied apartment market and parts of southeast Queensland’s housing sector are headed for a “bloodbath” in 2018, according to one property commentator.’
The irony is that the only places where you ever see reports of destabilizing oversupply are places where there is a destabilizing undersupply, because the destabilization comes from the fact that undersupply pushes prices far, far above replacement value. Moving from an undersuppled market to a properly supplied market is the only context where that “bloodbath” will happen.
This is the North-Wallis-Weingast problem in a nutshell. Once an economy is characterized by a limited access order regime, so that incomes and wealth are dependent on access to economic rents, then public opinion gets flipped upside down, and everything good becomes bad.
14. May 2018 at 14:28
Kevin, the paper co-authored by RBA assistant governor, Luci Ellis, arguably makes the opposite argument – that although markets with elastic supply may increase by less during the boom period, the potential for an overhang of supply after housing prices peak will be greater, and so the bust phase of the housing cycle could be more damaging to financial stability. See here and the following discussion: https://www.rba.gov.au/publications/confs/2012/pdf/conf-vol-2012.pdf
14. May 2018 at 15:45
I ditto Kevin Erdmann.
14. May 2018 at 15:47
Willy, People have been calling Australia a bubble since 2003. Yes, eventually there will be a drop in the Aussie market, but the timing is hard to predict. I don’t find bubble theories to be useful.
Rajat, Yes, I expect them to tighten, but if the slowdown is caused by slower labor force growth then it won’t be a problem. Otherwise unemployment may rise.
I don’t know if they’ll overshoot
The yield curve is a decent forecaster, but far from perfect. Right now it’s not signaling a recession; time will tell how it will look in two years.
Kevin, Good point. At least that’s usually the case (I suppose Phoenix and Vegas, circa 2006, might have bene truly an oversupply.)
14. May 2018 at 16:45
Rajat, thanks for the link. That paper is a good example of how off-base the entire literature is. It’s full of plausible mechanisms, but they don’t match what happened at all. The presumption that the bubble and bust was due to too much credit followed by oversupply is so strong that nobody has done the work to make sure it’s true. The data fit much better to a story that there was undersupply followed by a negative credit shock.
For example, they use Atlanta as an example of a city that experienced oversupply. Really, they just note that Atlanta builds a lot of homes (it’s a growing city), and then the price decline is treated as evidence of the oversupply.
Here is the rate of home building in Atlanta during the boom. There was no relative rise in the rate of new building during the bubble. The rate of building was about level for a decade until the bust.
https://fred.stlouisfed.org/graph/?id=ATLA013BPPRIVSA,
There was no significant rise in tenant vacancy in Atlanta at any point after 2005. (That’s as far back as the Census data go for MSAs.) Atlanta is not an outlier. Very few cities had any sort of shift in vacancies. Pretty weird for a country that supposedly needed years to work of oversupply.
The price declines they attribute to oversupply continue until 2012. But, housing starts were collapsing by early 2006. Prices didn’t even really decline much for more than a year after housing starts began to collapse. Then much of the collapse was after 2008 and 2010.
Here are a couple of posts where I touch on this. Those price collapses weren’t due to oversupply. Even in 2006, rents were rising as housing starts collapsed. The price collapse was due to a credit shock, and price movements in most cities coincide with the takeover of Fannie and Freddie and with the passage of Dodd-Frank, which you can see in these two links. When low tier home prices in Atlanta collapsed in 2010, when Dodd-Frank was passed, there really is no way to attribute that to building in 2005. Vacancies were low and declining in Atlanta in 2010, rent inflation was rising, and they had built very few houses for several years.
http://idiosyncraticwhisk.blogspot.com/2018/04/housing-part-292-dodd-frank-was.html
http://idiosyncraticwhisk.blogspot.com/2018/04/housing-part-293-how-has-dodd-frank.html
But, the presumption of oversupply is so strong, it can be stated without citation of any of these measures, and nobody doubts it.
14. May 2018 at 22:32
– “Why is Australian housing so expensive”:
https://www.youtube.com/watch?v=d6Po8Bf5dDE
From the truly excellent australian website MACROBUSINESS. These folks have a number of other videos on why the economic situation in Australia is so messed up (to put it friendly).
– @Kevin Erdmann: One has to look at the growth of credit. And that is caused by rising asset (e.g. housing) prices.
15. May 2018 at 02:04
– In the 1980s an australian house cost about 3 times income and now in 2018 such a house costs about 8 times income.
– In 2003 a house cost already some 4 times income and now 8 times income. It means that the hosuing bubble of 2003 only became (much) larger.
– And now that bubble is in the 1st stages of deflating.
15. May 2018 at 03:18
Willy2, it seems as though you’re saying that prices are too high, and that you want prices to be brought down through credit markets rather than through adding new housing supply.
This seems to be a common reaction people have to high prices, and I don’t understand it. Why not prefer supply?
15. May 2018 at 03:35
“So how do Japanese stocks react to global news that causes the yen to appreciate for safe haven reasons?”
Scott Sumner asked this at EconLog, where I am banned.
I have been covering the Nikkei 225 for a few years for a financial wire service. Stocks go up when the yen goes down, and vice-versa.
It happens so often, I use the expression, “hewed to pattern.” That is, “stocks hewed to pattern and fell on a rising yen.”
15. May 2018 at 03:48
No debt crisis in Japan says Goldman Sachs, or the US….
“A rapidly widening U.S. budget deficit is stoking fears among some economists of a potential debt crisis. Investors might want to look to Japan before pushing the panic button, say analysts at Goldman Sachs.
Daan Struyven and David Mericle, economists at Goldman Sachs, said the example of Japan could prove instructive as the world’s third largest economy had not suffered a debt crisis, even though it arguably has the most public debt as a share of its GDP in the world. Japan’s government debt to GDP ratio sits at 236% in 2017, more than double that of the U.S., which stands at 108%, according to the International Monetary Fund.
“Japan’s experience confirms that a debt crisis is difficult to imagine in a country that issues debt in its own currency, has a flexible exchange rate, and controls its central bank,” wrote Struyven and Mericle. All three features are also shared by the U.S.”
—-30—
So, la-de-dah.
And…from The Business Times
Kuroda’s stimulus saves Japan US$45b, easing debt pressures
TUE, MAY 15, 2018 – 5:50 AM
HARUHIKO Kuroda’s massive monetary stimulus has saved Japan’s government about US$45 billion in borrowing costs, helping the world’s most indebted developed nation pay for its debt pile.
Japan paid 7.4 trillion yen (S$90 billion) to service the 630 trillion yen in bonds it sold in the fiscal years 2013 through 2017. That means it saved 4.9 trillion yen, compared with what it would have paid if average borrowing costs in that period had been the same as in 2012….
—-30—-
The puzzle of QE continues. Is it stimulative? The Fed says hardly.
Inert? Then can a nation pay-down national IOUs without consequence?
Impolite questions nag at orthodox economics…..
15. May 2018 at 03:51
I can’t believe Aussies are talking about finance regarding house prices…..
https://theconversation.com/rba-research-shows-that-zoning-restrictions-are-driving-up-housing-prices-93064
The RBA says zoning…
15. May 2018 at 05:50
Kevin, don’t you also usually argue that inflation is actually overstated as a guide to the demand side of the economy? (Because supply side restrictions on housing in eg US and Australia cause a good chunk of the increase.)
That’s an interesting contrast to Willy2’s opposite statement about inflation being overstated.
15. May 2018 at 09:54
Willy2, Didn’t you predict the bubble was deflating years ago?
16. May 2018 at 00:44
– “Undersupply of houses/dwellings” ? That real estate prices rise doesn’t mean that there’s demand from people who want to actually live in those houses/dwellings. Some people buy real estate as a way to speculate and/or as an “investment”. That’s why you need to look at credit. Watch this video:
https://www.macrobusiness.com.au/2016/05/illuminating-melbournes-ghost-apartments/
– Real estate prices in the state of West-Australia (think: Perth. Australia is, like the US, a federation) have already fallen some 30% since the year 2008. No bubble ?? Watch the following video:
https://www.macrobusiness.com.au/2017/04/abc-wa-economicproperty-bust/
Transcript:
http://www.abc.net.au/7.30/perths-housing-slump-a-lesson-for-sydney-and/8474240
-And now it seems to be the australian east coast’s turn for the popping of the real estate bubble. When someone buys real estate then that buyer in Australia also must pay a socalled “Stamp duty” tax (a % of the buying price). In the australian states of New South Wales (think: Sydney) and Victoria (think: Melbourne) the revenues of this tax rose every year since the year 2008. But now the revenues of that tax are falling while the budgets of both states are (still) counting on a rising revenues from this particular tax. It’s a combination of fewer sales and lower real estate prices.
– We saw something similar here in the US. There were people who already warned in the year 2000 and 2001 for a US housing bubble. But US real estate prices went up for another four years. Yes, I was wrong when it comes to timing but the popping of the australian real estate market seems to be finally here.
– And also watch this video:
https://www.youtube.com/watch?v=hK6sLYMyltU
17. May 2018 at 10:32
– Indeed, I was. And I was too early. But now it’s for real.
– There’s one tell tale sign that the australian housing market has peaked. When someone buys a house in Australia then that someone also needs to pay a socalled “Stam Duty” tax (a % of the buying price). Since 2009 revenues of that tax kept rising in the states of Victoria (think: Melbourne) and New south Wales (think: Sydney). But only a few days ago is was reported that the revenues of this tax was shrinking. It’s a matter of fewer sales in combination with lower home prices.
– House prices have fallen in both Melbourne and Sydney.
– Home prices in Perth have already fallen some 30% since 2008.
– Do you want more evidence of the deflating australian housebubble ?
17. May 2018 at 13:38
– Came across another nugget. Home prices in Perth have fallen 6% in the last 2 years.
20. May 2018 at 07:47
– There’s more bad news for the Australian economy and the australian housing market. Some 60% of australian mortgages are “interest only”. Some 80% of those mortgages will reset in the next 6 years to a “Interest & Principal” payment system.
21. May 2018 at 07:43
Willy2,
Prices can go up or down, especially on a resource that is not tethered to replacement value. Credit markets can’t push home prices to twice their replacement value for years or decades. Only supply constraints can do that. Yet, certainly, any market will use money and credit, in proportion to the price and activity that exists in that market.
Now, imagine saying everything you are saying about housing, but instead, you are saying it about another resource that has wildly fluctuating prices because there isn’t a functional replacement value to moderate it – wages. If wages had been rising for a long time, and you started to see them fall, what would your reaction be? What policy response would you want?
Sure, there are caveats about trying to enforce nominally stable asset prices, but I would argue that these scenarios have as much in common as they have in differences, and the main factor that makes Australia today and the US in 2006 similar is that there is a loud and sometimes powerful constituency who operates with a “bubble” paradigm, which sees collapse as inevitable and something that should be accepted or encouraged by central banks and federal regulators.
Then, you get this public consensus that we knew the patient needed bloddletting last month, and when he died after we finally were able to drain him, it only proved that we needed to apply the cure earlier.
21. May 2018 at 07:51
Willy2, You don’t seem to understand. Bubblemongers don’t get second chances. If you were wrong, you are discredited. It’s that simple. All markets go up and down–we know that. If you tell me the Australian market is crashing, and it doesn’t, you are discredited. If you keep repeating the prediction over and over again, eventually you will be “right”, but your prediction will be useless.
Remember the boy who cried wolf?
21. May 2018 at 17:01
– @Kevin: If there’s an “undersupply” of real estate/dwellings then why are there A LOT OF empty/vacant apartments/condos in both Melbourne and Sydney ? (Did you watch the video above ?)
– If there’s an “undersupply” of dwellings then why are australian real estate developers increasing the incentives for (potential) buyers of that same real estate ? Then why are australian rents falling ? Lack of supply ? Lack of demand !
– After say the year 2000 australian wages have increased only modestly. The only way to explain the gap between wages and rising home prices is a thing called “credit (growth)”. Did one Kevin Erdmann never ever look at things called “wages” and/or “income” ?
– It’s one S. Sumner who has discredited himself by NOT recognizing the australian housing bubble. The fact that this same bubble hasn’t collapsed/didn’t deflate too much yet doesn’t mean there isn’t a housing bubble. And there’re some serious signs that the US currently has a second (although smaller) housing bubble as well.
– Question: Did S. Sumner regcognize the 1st US housing bubble (between say 2000 and 2006) ? If he didn’t then he has discredited himself even MORE.
– Steve Keen has one simple formula with which he showed that the US already entered a recession (although a mild one) in january of 2005 and NOT in november 2007 (think: NBER).
– With the same formula Keen shows that the US already entered a recession in december 2016. What do you mean “the economy is doing fine” ?