

State income taxes and government efficiency
Matt Yglesias directed me to this report on government efficiency:
Yglesias pointed out that both the blue state and the red state economic model can be efficient, citing the relatively high rankings of Texas and Massachusetts. Do you notice anything else about the most efficient states?
Check out this list:
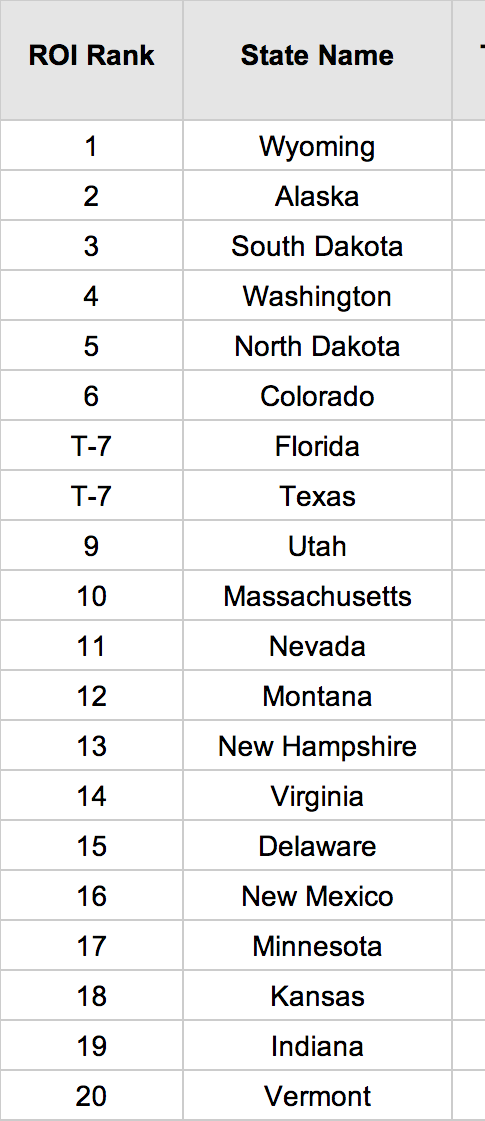
States with no income tax:
- Alaska
- Florida
- Nevada
- South Dakota
- Texas
- Washington
- Wyoming
States with nearly no income tax:
- Tennessee
- New Hampshire
All seven of the states with no income tax score at or near the top of the list of government efficiency by state. (#1, 2, 3, 4, 7, 8, 11) Coincidence? One must always remember that the human brain notices interesting patterns and discards the far more numerous non-interesting patterns, which is why claims made on the basis of 95% confidence intervals are often quite misleading.
Then I wondered whether the report had a strong conservative bias. That’s possible, but the bottom part of the report (#41 to #51, is dominated by a bunch of conservative southern states (including Tennessee.) Is there any explanation for Massachusetts? It does have a flat rate income tax with a much lower top rate than places like New York and California. Again, this could be a coincidence, but I do find it interesting.
Perhaps states that must rely on sales and property taxes are somehow more accountable to voters. After all, those taxes are fairly widely shared (‘regressive’ would be the term used by progressives.) Does this put more pressure on governments to deliver, as compared to places like New York and California, which can play around with large state income tax revenues from a tiny percentage of upper income taxpayers? Taxpayers that may stay put despite a poor ROI, because they find their states attractive in lifestyle terms?
The rich might care about theatre and restaurants, but the middle class is voting with their feet. Here’s an article discussing the real estate market in one city in one of the tax free states:
Houston had more new-home starts last year than the entire state of California . . .
Houston builders could be building and selling 50,000 new homes in 2014, but a shortage of labor and quality lots is suppressing the local construction industry somewhat.
Developers are responding to the need for more lots by creating new communities, such as Pomona, which was recently started by Ross Perot Jr.’s Hillwood company in Manvel, south of Houston.
Burns’ survey of the best-selling master planned communities in the nation shows that 10 of the top 25 are in Houston. “This is the capital of suburban master planned communities in the country,” he says.
Burns projects that Houston’s annual new-home starts will increase about 13 percent annually over the next three years, peaking at 50,000 starts in 2016.
One more reason to suspect the recession was never about unemployed construction workers. It was falling NGDP. We can’t even find enough construction workers and yet the consensus in Washington DC (Democrats and some Republicans) is that we need to renew the “emergency” unemployment compensation program. Meanwhile Janet Yellen thinks we need to taper to prevent overheating. I don’t know who’s right, but I suspect that within about 12 months it will be clear.
BTW, a few days ago Toyota decided to move from LA to Dallas, taking thousands of jobs. LA will be fine, but it will need to reinvent itself the way NYC did.
Tags:
6. May 2014 at 06:08
I don’t think the correlation is all that signficant. What you’re really seeing here is the states with better institutions. Places with better institutions also tend to have lower taxes, but aside from long-term incentive effects I’m not sure how much of a causative relationship you can draw between taxation and efficiency.
And I’d bet there are larger differences within states between counties — here in Illinois, for instance, Lake County is a lot different than Cook County.
6. May 2014 at 06:20
At first blush, using what I think is Scott’s general line of thinking I would expect Alaska to be rather inefficient due to the majority of its tax income coming from taxing oil production.
Only vaguely related to this post, but rather to a previous one on obamacare. Gallup’s last poll looking at the uninsured found a large drop in the past month, dropping to 13.4%. Reading around it seems the general consensus seems to be that one should that rate to continue to drop over the next few years as more people get incorporated into the system. I think that strengthens your idea that obamacare is being effective in ending involuntary uninsurance.
http://www.gallup.com/poll/168821/uninsured-rate-drops.aspx
6. May 2014 at 06:46
looking at the data, ROI — quality of service per unit of taxes is going to make cities with low tax rates look better.
If we sort by quality of service…
Qual….rank taxes
1..MN….38
2..VT….45
3..NE….49
4..NH….28
5..UT….14
the relationship doesn’t look so clear.
6. May 2014 at 07:44
Alaska’s state budget is 90% funded by oil revenues, equal to $50,000 for a family of four per year.
Alaska is regarded by locals as a socialist state–and well, with $50k per family per year–hey, socialism is affordable.
So I would leave Alaska out of the equation. It’s not an apple, for purposes of comparison. If you want to understand Alaska, think of the Cape Cod’s Outer Cape year-round residents with $50k the government could spend on them every year.
6. May 2014 at 08:43
Scott,
Read the report. Many of the measures of government services are quality of life measures not at all necessarily related to the quantity or quality of government services. The “ROI” is based on a ration of tax ranking to government services ranking. This is crap methodology. At a minimum you need a ratio of the absolute measure of both, not a ratio of relative rankings. IMHO, the report does not deserve your commenting on it.
6. May 2014 at 09:39
“One more reason to suspect the recession was never about unemployed construction workers. It was falling NGDP.”
No, because falling NGDP doesn’t explain why NGDP fell, despite the fact that the Fed was not destroying people’s money or forcing them not to spend it.
Falling NGDP is another effect of significant problems in the economy. There are good reasons why cash preferences rose as much as they did, when they did. It is because the Fed slowed down its OMOs and raised the Fed funds rate starting 2005-2006. This had the effect of putting pressure on business firms whose revenues depended on significant credit expansion founded upon low fed funds rate which was itself founded on a high quantity of OMOs.
In other words, if there were no investments founded upon and dependent on significant credit expansion, then a rise in interest rates would not have revealed any malinvestments.
(NGDPLT cannot solve this problem.)
In the next couple of years, as the easy money from the banks evaporated, business firms drew on money market funds to keep their businesses solvent. NGDP was falling somewhat during this time, but there was no precipitous decline at this time. Once those funds ran out around 2007, that is when NGDP really began to tumble. Unemployment rose because wage rates did not fall.
It was 2008-2009 that the Fed brought down the fed funds rate to 0.25%. Investors piled into treasuries, bringing those rates down. Corporate bond prices came down, partly because those yields are habitually linked to treasury bond yields plus a risk premium, partly because bonds are safer than equity, and partly because of deflation.
All this while NGDP fell. Ergo, we see commentary like “low interest rates are generally a sign money has been tight”, and “falling NGDP is the culprit”, when the actual culprit is absence of market driven spending, interest rates, and prices.
6. May 2014 at 10:06
dtoh, That’s what happens when I free ride on the assumption that Yglesias read the report. 🙂
Still, it’s an odd coincidence.
6. May 2014 at 10:21
The problem with CA is a non-professional political class due to term limits and, even worse, a proposition system that modifies the state constitution. It’s a terrible way to run a government and so the state under performs against fundamentals.
6. May 2014 at 10:22
Scott,
I think your thesis is logically sound. It’s just that the report provides no reliable empirical support for it.
6. May 2014 at 10:32
Scott,
Beyond what dtoh said, also note that the mere premise of these rankings imputing an (return on investment) “ROI” is financial smoke and mirrors. In finance, “ROI” reflects period returns on total invested capital. If the return “R” is being captured by these quality of life, etc. attributes and the investment “I” is simply being captured by some form of annual tax burden, it should not surprise that states with large historical “human and physical capital” can get a boost on these ratings. The real question then what are current tax burdens financing?
The Blue state model is a great model, if you could afford it — and I say “could” (past tense), as I wonder how many really “can” now.
6. May 2014 at 10:39
Scott,
Speaking of taxation what do you say to those who left winger economists who say that there is no reverse correlation between low capital gains taxes and high savings and investment?
6. May 2014 at 10:44
And isn’t the purpose of saving TWOFOLD, first to defer consumption, second to invest and build capital?
Keynes added a third motive the precautionary motive but I would argue that fits into deferred consumption of emergency services.
6. May 2014 at 11:26
and dont forget that Texas also gets money from oil and gas natural taxes. so it can get by with out having an income tax. and most of the Texas budget is really on auto pilot, and a lot of what the state does is also. with a few notable exceptions like that cancel ‘fund’ that seems to not really be what its suppose to be, plus that other ‘fund’ thats suppose to attract out of state businesses.
plus be sure to note that Toyota wasn’t even recruited (per the company) by the state. and it wasn’t lower taxes or regulations that got them to move. it was the lower cost of housing in Texas that did it. course having a plant in Texas helped, plus being in the central time zone too. but to offset all of this, they still have a drought to deal with, plus higher insurance (due to explosions from fertilizer plants exploding). oh and much higher electricity costs (from that deregulation, and the bankruptcy of the major electric utility)
6. May 2014 at 11:36
The real problem with states that rely on income taxes (especially highly progressive income taxes) is that tax revenue is highly volatile. When a state has a period of unusually high tax revenues, it spends the money freely and inefficiently. Worse, the state tends to enter into generous long-term contracts, which they’re stuck with when their tax revenues decline. California is the clearest example.
Highly cyclical tax revenues inevitably lead to wasteful spending followed by a budget crisis.
6. May 2014 at 15:48
For Toyota, it’s
1. Proximity to the auto corridor.
2. Quality of workforce
3. Absence of unions.
6. May 2014 at 18:16
“LA will be fine, but it will need to reinvent itself the way NYC did.”–Scott Sumner.
The city is booming, I do not know why exactly.
A very short history of postwar L.A.:
1950s-1960s post war boom, prosperity. Guys in tire plants in Commerce buy houses in Monrovia. Smog thicker than jello.
1970s–crime and decline, many neighborhoods decay (non-Westside decline)
1980s–more of 1970s.
1990– some mid-city neighborhoods stabilize, begin to get better.
2000–Many mid-city neighborhoods improve to the point of becoming unaffordable, driving gentrification further east
2008–recession busts real estate prices
2014 Housing prices recovered, I do not know how norma;l people can buy houses in Los Angeles….thriving restaurants everywhere….
I suspect L.A. attracts a lot of flight capital globally, and also has huge underground economy of cheap labor….and many institutions that attract residents, such as UCLA, USC, Caltech, LACMA, the Getty, dozens more….the weather is perfect, beaches, deserts, mountains…
No, the city government does not deserve the prosperity, nor the state, but there you have it….the smog is 95 percent better…if you have money, a more interesting city than ever…but bring lots of money…
6. May 2014 at 18:47
LA is beautiful youth and weather.
6. May 2014 at 19:23
dw wrote: “and dont forget that Texas also gets money from oil and gas natural taxes. so it can get by with out having an income tax”
This is complete and utter b—s—.
Texas gets less than 10% of its revenue from oil and gas taxes.
And California gets lots of revenue from 13% cap gains tax on social media/internet/tech bubbles. Not to mention the revenue California collects from natural beauty.
New York gets lots of revenue from bank quasi-monopolies, and bloated real estate owned by famous people.
Every state has an industry that contributes significantly to the tax base. In Texas, the production tax revenue is almost 10% of total revenue. So what? Lots of people work there…
Not sure where dw is from, but the left-coasts are full of ‘smart’ people who make stupid arguments for political purposes.
http://www.texastransparency.org/State_Finance/Budget_Finance/Reports/Revenue_by_Source/
7. May 2014 at 00:43
You should also have a look at income taxes in Switzerland. Like in the US, in Switzerland the states (called cantons) have the right to levy taxes. But, unlike in the US, the tax burden of these taxes at the state-level (for most people) actually matter far more than the Federal ones. The differences could thus be more “visible” in Switzerland than in the US.
7. May 2014 at 00:51
Seems to me I saw some cuties at Barton Springs…
7. May 2014 at 03:37
Scott,
“After all, those taxes are fairly widely shared (‘regressive’ would be the term used by progressives).”
A “regressive” tax system is a system in which low-income people pay a larger share of their income in taxes than high-income people. That is not the same thing as a system in which taxes are “fairly widely shared”.
7. May 2014 at 06:38
Prof. Sumner,
Re: FDR, 1933 and George Warren, you wrote the following:
“As far as I know every single economic historian, liberal and conservative, think Warren’s policy failed. Actually it succeeded. The dollar fell sharply between October 1933 and February 1934. Industrial production began rising and peaked in the spring of 1934.”
http://www.themoneyillusion.com/?p=4220
Which non-market monetarist economists out there recognize the huge success of George Warren’s dollar devaluation? Christina Romer? Ben Bernanke? Anyone else?
You and Glasner have done a great job of documenting its success. But your view of Warren’s program is very non-mainstream right? I mean, even Milton Friedman and Barry Eichengreen missed the importance of the program, right?
7. May 2014 at 07:38
Obvious bias towards states with low total taxes — declining marginal returns to almost everything in the world dictate that the less you spend on something, the more the average dollar spent will buy you. Better test would be to examine a given level of government services and see which states can deliver it most cheaply. I’m not sure how it’s taken into account, but red states also shift a lot of government burden to the federal government in ways that are hard to see (i.e. attracting employers with low minimum wages, which demands EITC payments for minimum wage workers from the federal govt). Not sure how the study accounts for that.
Also want to echo sentiment in a couple previous posts about natural resources. Five of the top 10 states by ROI are playing with other people’s money: Wyoming, Alaska, North Dakota, Colorado, and Texas. My gut feeling says the less salient the tax, the easier it is to spend the money on projects which might be high ROI but distasteful to people paying high income or property taxes (assistance to poor people, public education, public infrastructure investment, etc).
7. May 2014 at 07:48
“Everyone’s Flagging One Warning From Janet Yellen’s Testimony On The Economy”
http://www.businessinsider.com/janet-yellen-warns-about-housing-2014-5#!Kh07B
“readings on housing activity–a sector that has been recovering since 2011–have remained disappointing so far this year and will bear watching…
…the recent flattening out in housing activity could prove more protracted than currently expected rather than resuming its earlier pace of recovery…”
7. May 2014 at 07:57
“Jeff Gundlach’s Big Presentation On Why Homeownership Is Overrated And Why He’s Short The Homebuilders”
http://www.businessinsider.com/gundlach-2014-sohn-conference-presentation-2014-5
7. May 2014 at 13:25
I’m with the commenter who says the evaluation is bogus. Government “efficiency” is not a quality-of-life measurement.
Meanwhile, Texas has low unemployment but higher tax Massachusetts’ has even lower unemployment.
Among states, pre-ACA Texas still ranks 50th in percentage of population without health insurance, 45th in infectious diseases, 44th in children in poverty, 40th in overall health, 36th in high school graduation rate.
It also ranks first in release of air-borne carcinogens, fourth in toxic chemicals released into the environment, eighth highest in percentage of people below poverty level.
And, BTW, Toyota also built its manufacturing in Canada rather than across the border in the U.S. because health care costs (pre-ACA) were so much less in Canada.
7. May 2014 at 13:29
Scott,
Off Topic.
Krugman finds signs of secular stagnation where I find signs of tight monetary policy.
http://krugman.blogs.nytimes.com/2014/05/07/three-charts-on-secular-stagnation/
May 7, 2014
Three Charts on Secular Stagnation
By Paul Krugman
“…Beyond that, it does look as if it was getting steadily harder to get monetary traction even before the 2008 crisis. Here’s the Fed funds rate minus core inflation, averaged over business cycles (peak to peak; I treat the double-dip recession of the early 80s as one cycle):
[Graph]
And this was true even though there was clearly unsustainable debt growth, especially during the Bush-era cycle:
[Graph]
The point is that even if deleveraging comes to an end, even stabilizing household debt relative to GDP would involve spending almost 4 percent of GDP less than during the 2001-7 business cycle…”
Krugman’s first graph shows that the average real fed funds rate has dropped in each succeededing business cycle since 1980. But this implicitly assumes that the real federal funds rate was normal in the 1980s and 1990s.
Here’s the entire history of federal funds rate adjusted for core inflation, along with the real 10-year T-Note yield during the same period:
https://research.stlouisfed.org/fred2/graph/?graph_id=176709
From 1955 through 2013 the real fed funds rate averaged about 1.9%. The real funds rate averaged 4.7% from 1980 through 1989 and 2.9% from 1990 through 2000. These two business cycles have the first and second highest real fed funds rate in fed funds rate history.
A similar thing applies to the real 10-year T-Note yield. It averaged 2.9% from 1954 through 2013. But it averaged 5.3% in 1980 through 1989 and 4.3% in 1990 through 2000, which are the highest and second highest real interest rates among all the business cycles during this period. So the real interest rates were abnormally high in the 1980s and 1990s.
Krugman implies with his second graph that the growth in household leverage from 1980 to present was entirely due to household sector borrowing. Except as we have just observed real interest rates were unusually high in the 1980s and 1990s.
Here’s is the real 10-year T-Note yield (blue line) along with the real effective interest rate on household sector debt (red line):
https://research.stlouisfed.org/fred2/graph/?graph_id=176713#
It can be seen that the real effective interest rate on household sector debt is typically about a couple of points higher than the real 10-year T-Note yield. The correspondence is not perfect because the real effective interest rate on household debt is the real interest rate paid on the entire stock of household sector debt, not just the debt that was acquired in a particular year.
The real effective interest rate on household debt averaged 4.7% from 1952 through 2013, but it averaged 5.7% from 1980 through 1989 and 6.5% from 1990 through 2000, one again the highest and second highest rates among any of the business cylces during this period. So this implies that much of the growth in household sector leverage during the 1980s and 1990s was due to the unusually high real interest rates.
(continued)
7. May 2014 at 13:31
(continued)
The following graph shows the change in household sector leverage rate (blue line) and the household sector primary deficit (red line) with respect to disposable personal income(DPI):
https://research.stlouisfed.org/fred2/graph/?graph_id=176717
From 1981 through 2000 the household sector only ran a significant primary deficit in 1985. Thus the increase in the household sector leverage ratio from 1980 to 2000 was due almost entirely to the high rates of real interest. The primary deficits that the household sector ran in 2001-2007 were the first sustained household sector deficits since 1976-80.
And this means that real interest rates were unusually high in the 1980s and 1990s in spite of low, and not because of high, household sector spending.
And this in turn means that by looking at household sector leverage for clues about the future course of real interest rates Krugman is getting the causality exactly backwards.
7. May 2014 at 13:34
“The real effective interest rate on household debt averaged 4.7% from 1952 through 2013, but it averaged 5.7% from 1980 through 1989 and 6.5% from 1990 through 2000, one again the highest and second highest rates among any of the business cylces during this period.”
should read
“The real effective interest rate on household debt averaged 4.7% from 1952 through 2013, but it averaged 5.7% from 1980 through 1989 and 6.5% from 1990 through 2000, once again the highest and second highest rates among any of the business cycles during this period.”
7. May 2014 at 13:48
Scott,
Off Topic.
Mohamed El-Erian evidently needs monetary policy lessons from a Jedi Master:
http://www.bloombergview.com/articles/2014-05-06/even-powerful-central-banks-need-help
“As hard as the Fed and the ECB try, and both are trying very hard, neither can realistically deliver what is expected of them if they are left to carry the enormous policy burden on their own.”
Do or do not. There is no try.
https://www.youtube.com/watch?v=BQ4yd2W50No
P.S. Anyone who thinks the ECB is trying needs to look at this graph:
http://sdw.ecb.europa.eu/quickview.do?SERIES_KEY=123.ILM.M.U2.C.LT01.Z5.EUR
7. May 2014 at 15:00
Scott,
Off Topic.
Frances Coppola writes an informative post comparing three different Full-Reserve Banking proposals. But her conclusion seems a little off.
http://www.pieria.co.uk/articles/martin_wolf_proposes_the_death_of_banking
April 25, 2014
Martin Wolf proposes the death of banking
By Frances Coppola
“…But my bigger concern is this. Wolf’s idea amounts to replacing a demand-driven money supply creation mechanism with central planning of the money supply by a committee. Central banks’ record on producing accurate forecasts of the economy is dismal, and their response to economic indicators is at times highly questionable. Put bluntly, they get it wrong – very wrong, at times: consider the ECB raising interest rates into an oil price shock in 2011. Is the entire lifeblood of the economy to be dependent on the whims of such as these?
Some people suggest an algorithm-driven mechanism whereby the money supply automatically adjusts in response to economic indicators such as NGDP or money velocity. This is a neat idea, but it suffers from the problem of accuracy and timeliness of information. GDP is a flawed measure which is subject to constant revision. So is inflation. So is money velocity. And all of them are lagging indicators. How can the future money supply needs of the economy be accurately estimated using these?
Personally I would prefer the money supply to respond to demand rather than be decided by a committee, or an algorithm for that matter. I don’t in theory have a problem with removing the link between bank lending and money creation: bank lending is by nature pro-cyclical, so the money supply does tend to expand when it really should contract and vice versa. But until someone can identify a better indicator of demand for money, bank lending – or perhaps better, lending activity in the financial system as a whole, including non-bank lending – is the best we have and certainly a lot better than the MPC. The system we have is undoubtedly flawed, but Wolf’s alternative is a whole lot worse.”
I have no strong opinion concerning Full Reserve Banking, but there’s clearly a hole in Frances’ logic concerning the wisdom of having the Monetary Policy Committee (MPC), or an algorithm, replace our current “demand-driven” money supply mechanism.
Prior to hitting the zero lower bound, monetary policy was usually conducted by a committee, such as the FOMC or the UK’s MPC, setting a short term interest rate. The interest rate decision was driven by whatever the goals of the monetary policy committee might be, be they inflation targeting or some broader mandate. A change in the policy rate would have an impact on the broader economy and thus affect the demand for, and supply of, broad money.
Thus a committee was already indirectly determining the demand and supply of broad money. The only difference under the Full Reserve Banking proposals is that a committee would be directly determining the supply of broad money.
Since hitting the zero lower bound, and implementing QE programs, the conduct of monetary policy has changed substantially in both the US and the UK. Instead of the respective committees setting a short term interest rate, now they directly set ad hoc amounts of the supply of base money. In turn the open market operations responsible for achieving these ad hoc amounts of base money have directly changed the supply of broad money by virtue of the fact that they have effectively led to the central banks acquiring financial assets previously held by non-banks.
In other words, to a very great extent, the US and the UK already have a system where a committee is directly determining the supply of broad money. Furthermore it has been this way for over half a decade, so it is not of a ephemeral nature, and if the secular stagnation prognosticators turn out to be right, this situation could persist for many, many years to come.
So instead of fretting about what could go wrong if the supply of money falls into the hands of a committee, we should recognize this is in fact already the current state of affairs, and consequently we should come up with a better way how this process is handled.
P.S. The lack of accuracy in, and untimeliness of, information is actually a very strong argument in favor of setting policy according to a market based measure of NGDP expectations.
7. May 2014 at 17:57
The methodology does not seen to include all that subsidized wind energy in Texas. I wonder if that is big enough to pull the ROI down.
7. May 2014 at 18:55
Mark Sadowski,
Good stuff on Frances Coppola. To summarize what she misses:
(1) Coppola failed to consider or mention the best solution: futures markets where participants estimate future NGDP.
(2) Even in the absence of NGDP futures markets, if the Fed targeted the five-year TIPS spread, that would be a HUGE improvement over current practice.
7. May 2014 at 21:51
We need more inflation:
http://i.imgur.com/x97XYLL.jpg
Tuition prices are only skyrocketing. We need to get them to go into the stratosphere where graduates are indebted 4 life.
8. May 2014 at 05:36
Jason, I’d say they are wrong.
Ben, Very interesting. I’d say LA must have tons of goods jobs and the housing must be affordable. If the data shows otherwise, then the data is wrong. The population of LA is still growing fairly briskly.
Franz, Yes, I often discuss the Swiss model (which is my favorite.)
Philippe, That’s why I did not use the term ‘regressive.’ I said “widely shared.”
Travis, I don’t know of any major economists who understand Warren’s gold buying program.
Adam, That data is quite misleading, Texas does well in areas like public education.
Mark, I can’t even imagine how someone would claim the ECB has been trying very hard to boost the eurozone economy.
Mark, What does Coppola mean by having monetary policy respond to the demand for money. How is money demand measured?
8. May 2014 at 05:50
Prof. Sumner,
Which of FDR’s actions in 1933 did Bernanke, Romer and/or Eichengreen understand well and which ones didn’t they understand well?
8. May 2014 at 09:23
Scott,
according to this report:
http://ctj.org/ctjreports/2014/04/who_pays_taxes_in_america_in_2014.php,
low-income groups do pay a larger share of their income in State taxes than high-income groups, but the opposite is the case with federal taxes.
8. May 2014 at 13:07
Prof. Sumner,
Yglesias has a new post on “bubbles.” I think you’d enjoy it.
http://www.vox.com/2014/5/8/5691670/Marc-Andreessen-theory-of-the-bubble-in-bubble-spotting
8. May 2014 at 15:36
First, re: Houston. No zoning laws in Houston, California zoning laws are numerous. Second, lots of new oil found in Texas. In California, ground zero for the world housing crash, they have a governor trying to push for a bullet train. No need to do too much analysis.
Third, ROI and Government spending is, at best, an exercise in imagination. ROI is an accounting concept which in the long run aligns with economic and cash flow returns.
This is not to say Government spending cannot be efficient–although most of it is not I believe—but I have not seen anything overly persuasive on believable measurement.
8. May 2014 at 16:39
oddly enough i am from Texas. and have been for oh, about 40+ years. and its a lot more than 10% cause its also used to provide money for 2 of the biggest colleges in the state, you may have heard of them. and my only point was it allows the state to skip an income tax, because unlike other industries, oil and gas have been pretty much consistent revenue producers.
8. May 2014 at 16:46
and Toyota will still have unions (if they did before) when they move. but that wasnt the reason for the move, nor was taxes, since they know how to deal those. it was mostly the low cost of housing (which is part of the reason we escaped the housing bust for the most part), and lets face it, we are cheap, as wages in Texas are much lower than else where (good thing standard of living is lower too, or we would really be in trouble). and while we dont have zoning laws, we do have deed restrictions which seem to work just like zoning laws
9. May 2014 at 03:53
OT but in the ballpark of this blog:
Marcus Nunes has good post on Yellen’s testimony before Congress…the “dove” Yellen is now defining 2 percent inflation as a ceiling….I guess that means the target inflation rate is 1.5-1.7 and indeed that is just about where we are (PCE).
9. May 2014 at 05:42
Travis, My general impression is that almost all macroeconomists misunderstood the October 1933 gold buying program. That Yglesias post is a good one.
Philippe, Those reports look at the legal incidence of taxes, not the economic incidence. But it’s the economic incidence that matters.
Mike, Good comment. I’d add that California also has lots of oil, they simply choose not to produce it. So Texas is not “lucky” because it has lots of oil.
9. May 2014 at 11:14
Came here to post about Nunes’ Yellen post that Cole referenced. Doesn’t that mean that the Fed thinks (rightly so) that NGDPLT would be a disaster? If 3+% inflation is doomsday scenario, I don’t see how NGDPLT is a good idea
9. May 2014 at 19:25
Prof. Sumner,
I’m curious whether you have any unique insight on Tim Geithner’s revelations in his new book…….
http://equitablegrowth.org/2014/05/09/timothy-geithner-department-wtf-friday-focus-may-9-2014
10. May 2014 at 09:30
wufwugy, The NYT misquoted Yellen.
Travis, The issue is not whether banks are dumb, lumbering giants, but rather whether the government is any less dumb and lumbering. And the answer is it is not any less dumb and lumbering.
11. May 2014 at 10:22
Mark,Scott,
I have responded to your comments here:
http://coppolacomment.blogspot.co.uk/2014/05/martin-wolf-proposes-death-of-banking.html?showComment=1399832275242#c1260847862105795694
The difference between fractional reserve and full reserve banking is key to the post and my conclusion follows from that difference. I am surprised therefore that both of you ignored it.
11. May 2014 at 16:56
Frances, OK, I read that comment. But I still don’t understand what it means for the money supply to respond to the demand for loans. Respond in what fashion?
12. May 2014 at 09:14
Frances,
I think I understand the implications of Full Reserve Banking extremely well so that is not at all the issue. The issue is that you don’t seem to appreciate the degree to which these things are already necessarily and desirably determined by the decisions of the FOMC and the MPC.
From the standpoint of monetary policy, a move to Full Reserve Banking (something I think is designed to address a problem which simply doesn’t exist) only changes the nature of how these things are determined. Frankly, saying monetary policy committees have a poor record in the conduct of monetary policy is an absolutely appalling counterargument.
I loathe analogies, but it’s like saying the bus driver is a bad at driving so we shouldn’t enhance her ability to control the vehicle. The full implication of your argument is that we should simply disconnect the steering wheel and take what comes.