

My 3% NGDP trend prediction, 2 years later
Back in July 2014, I made a prediction that 3% NGDP growth was the new normal, as soon as unemployment fell to the natural rate. At the time, that prediction raised some eyebrows. The 12-month NGDP growth rate was running 4.5% in the second quarter of 2014, and rose to 4.9% in Q3. The Fed’s estimate of the long-term growth trend was considerably higher than 3%, as were private forecasters. But look what’s happened since:
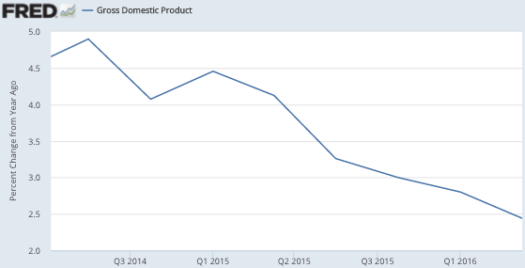 The NGDP growth rate has fallen below 2.5% over the past 12 months. That’s partly due to the falling oil prices, and I expect inflation to bounce back a bit. But I also expect the unemployment rate to stop falling soon, so I’m sticking with 3%, which looks increasingly likely as a long run NGDP trend.
Here’s what I said in July 2014:
3. The Fed has a big NGDP problem. It’s becoming increasingly clear that when the labor market recovers, RGDP growth will be very slow, maybe 1.2%. Add in about 1.8% on the GDP deflator, and 3% NGDP growth looks like the new normal, assuming the Fed intends to stick with 2% PCE inflation targeting. Bill Woolsey wins!! Here’s the problem. The Fed wants to do both of these things:
a. Continue targeting inflation at 2%.
b. Continuing to use interest rates as the instrument of policy.
But it won’t work. At 3% trend NGDP growth, nominal interest rates will fall to zero in every single recession going forward. The Fed will be spinning their wheels just when monetary stimulus is most needed. At some point they will need a new policy instrument/target. Lars Christensen has a very good post discussing a clever idea by Bennett McCallum, but in my view this idea works better for small countries than for the US, which is likely to follow the global business cycle. NGDP futures anyone? Level targeting?
4. Unemployment is likely to fall to the natural rate (estimated by the Fed at 5.6%) quite quickly. There will be a debate about what to do next. It will be the wrong debate. The debate needs to be about where the Fed wants to go in the long run. First figure out where you want to go in the long run, then adjust your short run policy as needed. Otherwise the blogosphere debate will be like a bunch of drunken frat boys arguing about which street to take, when they can’t even agree on which bar they are going to.
As I expected, unemployment did fall to 5.6% fairly quickly, more rapidly than the Fed predicted. And growth in both nominal and real GDP was slower than the Fed predicted. So how was I able to beat the highly skilled Fed forecasters at their own game?
The answer is simple. Way back in 2011 I noticed that this was a “job-filled non-recovery”, while most pundits were still talking about a jobless recovery. That is, I noticed that RGDP was not recovering as expected, but the unemployment rate was falling rapidly. And this process has continued up until the present. By 2014 I had seen enough to regard this strange pattern as more than a fluke, rather as the new normal. The asset markets (long term bond yields) were clearly signaling more slow NGDP growth ahead. Thus I figured that if the unemployment rate is falling rapidly, and NGDP growth is still only about 4%, you know that when the unemployment rate stops falling, the NGDP growth rate will slow dramatically. And that’s exactly what happened. The trick was to take the data seriously, and not assume we were going to return to some mythical “normal” level of NGDP growth.
Unfortunately, monetary policy remains just as dysfunctional as I feared. The Fed still relies on interest rate adjustments in a world where we are going to be permanently close to zero rates, and at or below zero in every single recession where we need stimulus. They have not adopted any of the new procedures suggested by elite economists (including Bernanke) for such a world, such as a higher inflation target or level targeting. They are very reluctant to admit the obvious; their current policy regime is not working.
And the drunken frat boy metaphor still applies. There are all these meaningless debates about whether to raise interest rates, with no consideration of what sort of NGDP growth rate is appropriate. No debate about level targeting. What are we trying to achieve? As a result, inflation has averaged well below 2% during the period of high unemployment, whereas under the Fed’s dual mandate inflation should average above 2% during slumps, and below 2% during booms. They have things backwards and don’t even seem to realize it.
The Fed has thrown in the towel and admitted that they will not raise rates 4 times this year. (The markets predicted 2 times, which itself may be an overestimate.) How long will it take for the Fed to throw in the towel and admit that under its current operating procedure 3% NGDP growth is the new normal? (Bullard will probably get there first–he has an open mind, and takes the data seriously.) And how long until they realize that this sort of NGDP growth rate makes interest rate targeting almost useless as a monetary policy instrument?
PS. Think about this for a moment—the US real GDP grew about 1.2% over the past year, and the unemployment rate fell. This disconnect between growth and unemployment also explains why I don’t expect the UK unemployment rate to rise very much after Brexit (I predicted a 50 basis point increase.) My hunch is that Brexit will hurt UK GDP more than it hurts their job market.
PPS. Another Trump lie, another promise broken. But hey, the GOP convention is over now. (Just to be clear, I do not think candidates should be required to release tax returns. But if they campaign for the nomination on a pledge to release them before the election, then they should honor that pledge. Now watch the Trumpistas tell me how naive I am. “All candidates lie that they will release their tax returns, and then renege on the promise. Don’t you understand that.” Oh really, which ones specifically?
HT: Tom Brown
Tags:
29. July 2016 at 07:53
So we are indeed ‘turning Japanese’? It’s hard to think that’s a disaster, it’s more like a very slow gentle deceleration. But it doesn’t feel very American.
29. July 2016 at 07:54
Scott, the economy is right where the Fed wants it. The risk now is that, by sticking to the rate normalization framework, things will get worse than they desire.
https://thefaintofheart.wordpress.com/2016/06/05/were-almost-there-a-narrative/
29. July 2016 at 07:59
As to stalled growth and the credit part of the process: a lot of issued mortgage debt can be considered long term claims on high value skill potential. However the Fed has become reluctant to stake claims (via mortgage credit) on “mediocre” skill sets as a potential growth function. The paradox is that if they were to adopt NGDPLT, this lackluster growth strategy would be a lot less cumbersome than it is right now.
29. July 2016 at 08:12
RGDP just isn’t going to recover very much without substantial supply side and structural reforms. And both candidates in this election are uninterested in entitlement reform. It doesn’t seem like these will be on the agenda for the next few years. In Greenspan’s interview yesterday he talked about how the uncertainty over supply side policies and possible reforms was restricting long term capex investments which in turn limits productivity growth which means that there will be little to no RGDP growth.
This si a fine mess we’re in.
Meanwhile the Fed wants to raise rates but knows it can’t without plunging the globe into a downturn.Why it’s not even considering going in the opposite direction is rather weird, but maybe with today’s second quarter GDP announcement of 1.2% (h/t to your prediction skills) will spur that conversation at least.
29. July 2016 at 08:19
Excellent blogging.
Send in the helicopters. There are global gluts in eeverything, including capital. We could have a five- to 10-year run of prosperity. Fat City.
In fact, cancel the helicopters.
Send in the B52s.
29. July 2016 at 08:33
“That’s partly due to the falling oil prices, and I expect inflation to bounce back a bit.”
———–
No, it’s not supply, it’s demand. Money flows, peak to trough, from 1/1/2013 to 1/1/2016, fell by 80 percent. Oil fell by 70 percent.
Economic prognostications within 1 year have been infallible for over 100 years. The Treasury will be scratching its head again (like Oct. 15, 2014) this December.
The decline in capex was theoretically put forth in the late 1950’s. It has now been played out. What wrong is that public enemy #1, the ABA, had forced Congress to completely deregulate commercial bank interest rates. The non-banks were already deregulated prior to 1966 (the “golden era’ in U.S. economics).
And this is an insidious error. Why? Because it is impossible for the CBs (as a system) to attract any additional savings by paying depositors interest on their savings accounts (unless foreign deposit flows are considered). This applies to all investments made directly or indirectly through the non-banks. Savers never transfer their savings out of the CB system.
I.e., the NBs are already the CB’s customers. And remunerating excess reserves (beginning in Oct 2008), supersaturates savings (TBTF) within the CB system (the 1966 S&L credit crunch is the economic paradigm). The undiscussed upshot is that both the CB’s and the NB’s ROE and NIMs collapse.
Paying interest to capture deposits for a BHC is virtually tantamount to redlining or redistricting (monopolistic price practices by the oligarchs – the most dominant economic predator). The DFIs simply pay interest to attract and concentrate deposits (redistribute liabilities), in another specific geographical region for some questionable speculative purpose. The longer-term outcome is that the cap-ex ratio (capital expenditures as a share of cash flow), used as the essence of business decision making, is persistently constrained.
It is axiomatic. Absent the syndication of the distribution channel (matching savings with investment), I.e., the pooling and utilization of existing funds, nothing will be capitalized. Idling funds which constitute a prior cost of production, cannot but have a long-term corrosive and deteriorating impact on effect demands, AD, especially the demand for capital goods.
29. July 2016 at 08:33
Any good theories on why this is the new normal? Also would this have happened even without the 2008 recession?
29. July 2016 at 08:40
@Benjamin:
“Send in the B52s.”
Love Shack, baby!
29. July 2016 at 08:41
Money is the measure of liquidity, the yardstick by which the liquidity of all other assets is measured (viz., bank debits, money actually exchanging counterparties). Any other interpretation becomes mired in a futile discussion of relative degrees of confidence and liquidity.
In almost every instance in which John Maynard Keynes wrote the term bank in “The General Theory of Employment, Interest and Money” published in Feb. 1936 (his magnum opus), it is necessary to substitute the term financial intermediary (non-bank) in order to make Keynes’ statement correct. This is the source of the pervasive error that characterizes the Keynesian economics (that there is no difference between money and liquid assets).
This was the Gurley-Shaw’s thesis, e.g., the elimination of Reg. Q ceilings for just the commercial bankers, the DIDMCA of March 31st, 1980, the Garn-St. Germain Depository Institutions Act of 1982, the Financial Services Regulatory Relief Act of 2006, the Emergency Economic Stabilization Act of 2008, sec. 128. “acceleration of the effective date for payment of interest on reserves”, etc.
29. July 2016 at 08:47
Remunerating IBDDs (both excess and required), a monetary policy blunder, inverted the short-end segment of the NB’s funding yield curve (this short-term, wholesale, money market, segment of saver’s/investor’s money (in the borrow-short to lend-long in the savings-investment paradigm), or the syndicated distribution of pooled savings, matches savings with longer-term capital market investments).
Remunerating IBDDs @ .25%, inverted the yield curve up to 1 year at first (which immediately destroyed money velocity, or specifically NB lending/investing (aka, the 2008-2009 credit crunch), then as QE progressed, inverted the yield curve all the way out to 2 full years (which ultimately contracted the E-$ market). The 1966 S&L credit crunch is the economic paradigm.
See:
http://www.zerohedge.com/news/here-why-fed-will-have-do-least-another-36-trillion-quantitative-easing
Taken from Zoltan Pozsar, Senior Advisor to the Office of Financial Research, U.S. Treasury
That explains why interest rates fell after QE operations:
http://www.pieria.co.uk/articles/does_qe_lower_or_raise_interest_rates_the_evidence
29. July 2016 at 08:51
The lending capacity of the CBs is dependent upon monetary policy, not the savings practices of the public. The CBs could continue to lend even if the non-bank public ceased to save altogether.
When Dr. Alton Gilbert, senior monetary economist, FRB-STL, wrote “Requiem for Regulation Q. What it Was and Why it Passed Away”, Gilbert asked the wrong question: His implicit and false premise was that savings are a source of loan-funds to the banking system. Thereby in his analysis, Gilbert assumes that every dollar placed with a non-bank deprives commercial banks of a corresponding volume of loanable funds.
Gilbert asked: Was the net interest income on loans/investments derived from “attracting” these savings deposits greater than the interest attributable to the direct and indirect operating expenses of this “funding”?
I.e., the CB’s earning assets, which are erroneously regarded as being derived from savings, actually were already in existence before the time/savings deposits even came into being!
CBs, as a system, simultaneously pay for all their earning assets with new deposits. The complete deregulation of interest rates means that the banks, which pay for something that they already own, are now, collectively, much less profitable (lower ROE and NIMs for both the NBs and CBs). The 1966 S&L credit crunch is the economic paradigm.
All time/savings deposits are the indirect consequence of PRIOR bank credit creation. The source of all time/savings deposits to the CB system is other bank deposits, directly or indirectly via the currency route or thru the CB’s undivided profits accounts.
I.e., CB time/savings deposits, unlike savings-investment accounts in the “thrifts” (non-banks), bear a direct, one-to-one relationship, to transactions accounts. As time deposits, TDs, grow, transaction deposits, TRs, are depleted, pari passu, and vice versa. And the growth of all deposits is traceable to the expansion of bank credit.
29. July 2016 at 09:22
Scott,
You say “they don’t even realize they have it backwards.” It seems to be worse: they want to have it backwards.
http://www.bloomberg.com/news/articles/2016-07-12/fed-resists-imf-call-to-allow-some-overshoot-of-inflation-goal
‘The IMF last month recommended the Fed accept “some modest, temporary overshooting” of its 2 percent inflation target, given the risk that price increases will slow and the central bank may have to reverse course after raising its benchmark rate in December for the first time since 2006. The IMF made the call in a June 22 statement following the fund’s annual review of the world’s biggest economy.
The full version of the staff report released Tuesday revealed that U.S. authorities have “no intention to engineer an overshoot” and said the case for doing so wasn’t compelling.
“Aiming to overshoot the medium-term target would create the risk of being behind the curve and potentially being faced with a need to raise rates more quickly especially if the labor market tightening led to a faster increase in inflation than seen until now,” according to the IMF report, which attributed the comments to U.S. officials. “This could be disruptive and undermine the achievement of the Federal Reserve’s mandates of maximum employment and stable prices.” ‘
29. July 2016 at 09:40
Just to hit a well-beaten issue one more time, while the headline unemployment rate is low, there is still room for the U6 “real” unemployment rate to fall before we reach pre-recession lows:
http://www.gallup.com/poll/189068/bls-unemployment-seasonally-adjusted.aspx
29. July 2016 at 10:03
Scott, on the GDP unemployment disconnect, do you have a model in mind? Is it that sticky wages finally adjust even in a low inflation environment ( hence low unemployment) but that overall growth is low in a low monetary growth environment due to a lack of willingness to invest without clear price increases? Or something else?
29. July 2016 at 10:26
Overshoot? That will produce stagflation (declining standards of living).
Monetary policy now is set up to act in reverse (raise the remuneration rate and the economy immediately sputters/stalls). I.e., raising the remuneration rate induces non-bank disintermediation and lowers money velocity, viz., AD.
QE was supposed to grease the wheels (velocity). It should accelerate decision making. It should redistribute income – not financial investments (from strong hands to weak ones).
Once you change the risk value (swap or convert assets), the markets should reallocate and rebalance. Rebalancing alters the asset mix. It makes the market re-examine, & revalue, asset linkages. It changes support & resistance lines. It increases the demand for speculative loan-funds.
But this scenario can only be accomplished by getting the CBs out of the savings business. The economy will eventually flat-line. Entitlement funding requirements will guarantee it.
29. July 2016 at 10:36
Alan Blinder: “After the Music Stopped”
“Bubble bursting is like that. At some unpredictable moment, investors start “looking down” (think Willie E. Coyote), realizing that the sky-high prices they believed would never end are not supported by the fundamental – and start selling. It is abundantly clear that the crash must come eventually. Fundamentals win out in the end. But why it happens just when it does is always a mystery.”
Alan Greenspan: “The Map and the Territory”
“with rare exceptions it has proven impossible to identify the point at which a bubble will burst, but its emergence and development are visible in credit spreads”
Ben S. Bernanke: “The Courage to Act”
“First, identifying a bubble is difficult until it actually pops”
———-
They are all ignorant.
Every year, the seasonal factor’s map, or scientific proof, is demonstrated by the product of money flows M*Vt, at least for the last 100 + years, or as long as there are statistics, every time the rate-of-change in monetary flows (our means-of-payment money times its transactions rate-of-turnover), drops into negative territory – we get a recession (i.e., proxy for real-output).
29. July 2016 at 10:38
I’ve already denigrated Nassim Taleb’s general theory of the “black swan” (the failure of circuit breakers and limits on high frequency trading) of May 6th 2010. I.e., I predicted the “flash crash” 6 months and within one day of the 1000 point swing.
– Michel de Nostradame
29. July 2016 at 10:55
Each year the 1st qtr. has come in progressively lower. Next year’s 1st qtr., in 2017, currently looks ominous…
29. July 2016 at 10:57
This should not be a mystery and it is not part of some unavoidable long term problem. It’s housing.
Residential investment had ranged from about 4% in recessions to 6% in recoveries for decades. After 2008, it fell to 2.5% and is STILL below 4%. We have closed down the mortgage industry for many households. Just getting residential investment back to recovery levels adds 2% to real GDP.
And, since there is a growing shortage of housing, RGDP is currently understated. Rent inflation is just a transfer to economic rents to the increasingly exclusive ownership class. It is subtracted from NGDP as inflation to get to RGDP, but really it isn’t monetary inflation, it’s a capture of rents. It’s a transfer. So, RGDP is a little higher than it looks. And NGDP is low because inflation outside of rent is well below 2%.
29. July 2016 at 10:57
https://fred.stlouisfed.org/series/A011RE1Q156NBEA/
29. July 2016 at 11:42
“Residential investment had ranged from about 4% in recessions to 6% in recoveries for decades”
—————-
“Residential construction, which is normally about 4 percent of gDp, soared to as high as 6.3 percent in 4th qtr. of 2005”
-Alan S. Blinder
I’ve already predicted the stronger 3rd qtr.:
“John, the #’s (which represent AD), for the 3rd qtr. are 2x that of the 2nd qtr. And that’s without extrapolation and assuming Vt remains constant (& Vt will rise). – 20 Jul 2016, 06:50 PM
“Roc’s in money flows (the proxy for real-output, or AD), peaks in the 3rd qtr., not the 2nd. Subsequent news in the financial press will eventually confirm this.” – 21 Jul 2016, 12:28 PM
There’s no accountability on blogs.
29. July 2016 at 11:49
Based on Kevin’s link:
Covering the period from 1980 to the present, “Shares of gross domestic product: Gross private domestic investment: Fixed investment: Residential (A011RE1Q156NBEA)” averaged 4.31 percent thru thick and thin.
29. July 2016 at 12:04
Yale Professor Irving Fisher – 1920: “The Purchasing Power of Money”
“If the principles here advocated are correct, the purchasing power of money — or its reciprocal, the level of prices — depends exclusively on five definite factors: (1) the volume of money in circulation; (2) its velocity of circulation; (3) the volume of bank deposits subject to check; (4) its velocity; and (5) the volume of trade. Each of these five magnitudes is extremely definite, and their relation to the purchasing power of money is definitely expressed by an “equation of exchange.”
“In my opinion, the branch of economics which treats of these five regulators of purchasing power ought to be recognized and ultimately will be recognized as an EXACT SCIENCE, capable of precise formulation, demonstration, and statistical verification.”
Economics is a science. As Fisher pontificated “it all depends on the right index number”
29. July 2016 at 12:24
Vladimir, Yes, I’ve done posts on that. Slower labor force growth, slower productivity growth, slightly undershooting inflation target, etc.
ChrisA, Mostly slow wage growth.
29. July 2016 at 15:54
Is the 10 year Treasury at 1.5% consistent with 3% NGDP growth?
Should we be going long or short the 10 year T at this time?
29. July 2016 at 17:53
If you short the Treasury bond, you have steel cajones, or extra money you don’t want to sacrifice. Yield tantrums come and go, and always go because when yields go up, the people who need the collateral buy buy buy.
As the link to my name suggests, Greenspan is engaged in a tantrum for his investors. JMO.
29. July 2016 at 23:36
3% NGDP growth surpresses flexibility of real wages and leads to weak productivity growth.
https://thefaintofheart.wordpress.com/2016/07/17/what-a-healthy-us-labor-market-looks-like/
29. July 2016 at 23:50
And low productivity growth means low RGDP growth.
30. July 2016 at 08:49
Bill, I don’t even try to predict bond prices.
30. July 2016 at 11:00
That is because you don’t understand the demand for bonds, Scott. The demand is massive and getting ever more massive daily. Both BIS rules and clearinghouse demand push bond prices up, up and away.
Why don’t you continue to ignore me, and just ask David Beckworth, or Gary Gorton.
15. August 2016 at 02:55
With all due respect to drunken frat boys, it’s perfectly sensible to argue over what street to take even without agreeing on what bar to go to if all the bars are on the same street, there’s no free street parking available, and there’s only one parking garage nearby.