

Global growth
McKinsey sends me their global economic reports, which are also available online. This caught my eye:
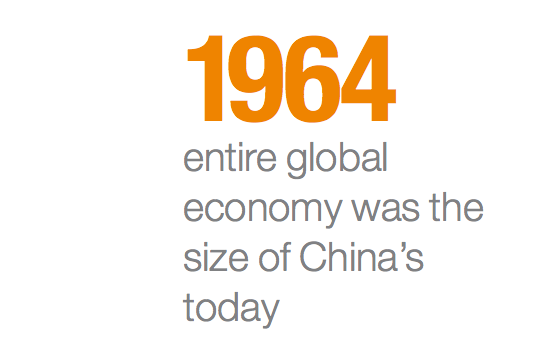 How is that even possible? Here’s how:
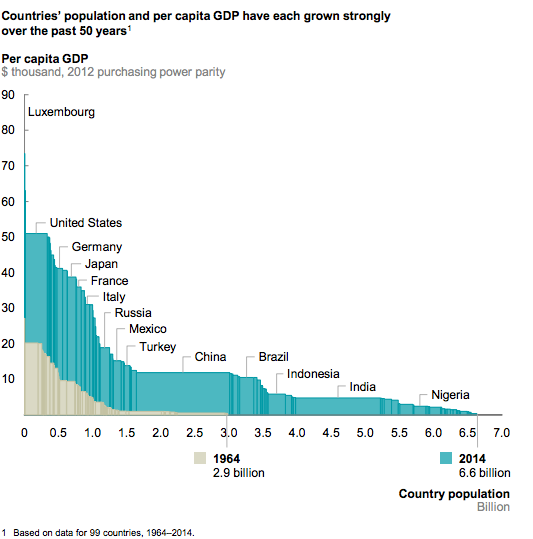
You can see that the horizontal box representing China is about the size of the beige triangle, representing global GDP when I was 9 years old. America’s per capita GDP has more than doubled. The biggest gains went to blacks, Hispanics and Asians (in the case of the latter two groups, partly because many were living in other countries in 1964.) But whites are also modestly better off.
Of course that’s not where the action is. In 1964 China was about as poor as the worst basket case in the world today. Poorer than India in 1964. You can barely see the rectangle. So if you wanted to explain to someone from outer space what happened to the world over the last fifty years, you’d say Asians got a lot richer. Everything else is a footnote.
Here’s another nice graph:
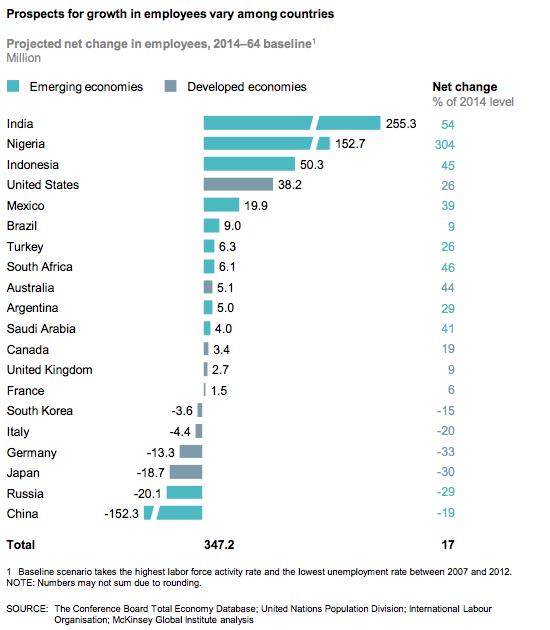 So that group of countries will gain 347 million workers (2014-64), but India and Nigeria alone gain 408 million. Again, China is the elephant in the room, losing a massive 152 million workers.
The next graph shows the uncanny similarity between India and Indonesia, both over the past 50 years and the next 50.
Be careful, however, they have South Korea growing 4.3%. South Korea’s already a developed country, and even McKinsey admits their population will decline. If they growth 4.3% over the next 50 years then I will be the next Pope. Perhaps they confused the two Koreas—North Korea will probably be the fastest growing country in the world over the next 50 years. Japan’s growth rate will be close to zero, not 2.1%.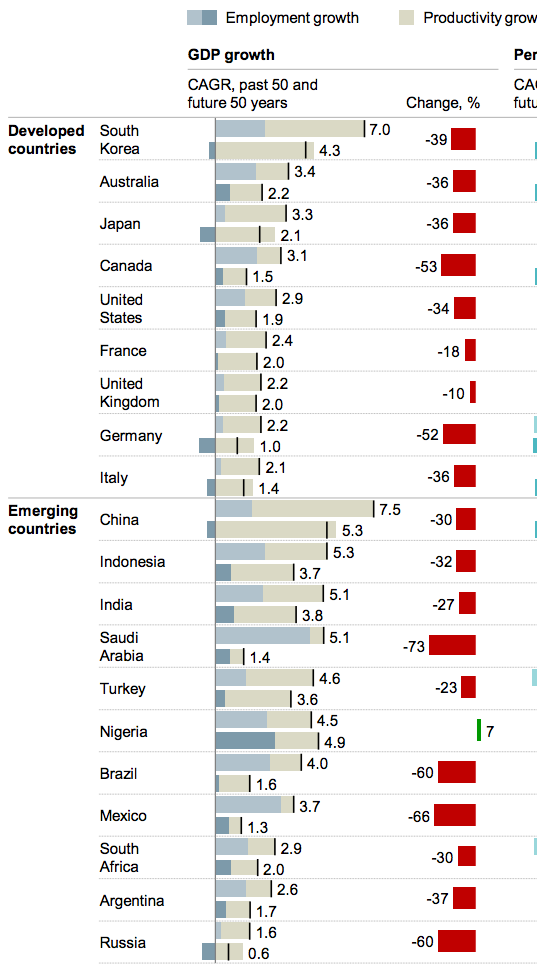
Tags:
22. March 2015 at 07:15
Maybe the Mckinsey author had a surname like Lee.
Or maybe robotics is big in Korea.
What if going to the doctor means peeing in a cup and pricking a finger and pointing your smart phone at the results?
Pope John Paul Sumner?
22. March 2015 at 08:25
Maybe they expect South Korea to catch up with the U.S.?
22. March 2015 at 08:31
Also, I firmly doubt Russia will lose more workers than Japan. Russia has more liberal immigration policies and has a higher TFR, combined with stronger natalist policies than Japan.
22. March 2015 at 08:38
Scott,
First, thanks.
The McKinsey report link is a local link.
22. March 2015 at 09:23
Nice post Scott. One of the reasons this blog stays relevant.
22. March 2015 at 10:23
Don’t read this please… Off-topic unless you really care about monetarism. From an excellent paper by Richard A. Werner, Friedman on the quantity theory of money, found it has “uniformity… of the same order as many of the uniformities that form the basis of the physical sciences. And the uniformity is in more than direction. There is an extraordinary empirical stability and regularity to such magnitudes as income velocity that cannot but impress anyone who works extensively with monetary data” (Friedman, 1956, p. 21). He still called it [the quantity theory of money] “an identity, a truism” decades later (Friedman, 1992, p. 39). Handa (2000) still wrote, somewhat confidently, that equation (1) “is valid under any set of circumstances whatever since it can be reduced to the statement: in a given period by a given group of people, expenditures equal expenditures, with only a difference in the computational method between them” (p. 25). … However, from the early 1980s onwards, faith in this link had been increasingly shaken by the widespread and growing empirical observation that velocity had become erratic, was declining significantly and the money demand function was unstable (e.g. Hendry, 1985; Belongia and Chalfant, 1990; Boughton,1991)
22. March 2015 at 10:30
(1) Happiness rankings according to the U.N.:
http://fivethirtyeight.com/datalab/celebrating-happiness-day-with-the-happiest-and-saddest-countries
(2) Prof. Sumner wrote this brilliant old post where he asked “What if utility and happiness are unrelated?”
http://www.themoneyillusion.com/?p=8311
22. March 2015 at 10:50
E. Harding, Korea would be far ahead of the US.
I do agree about Russia.
Absolute, Thanks, I’ll try to fix it.
Thanks Jon.
Ray, The skunk at the party again. Your comment is so idiotic I can’t imagine that even you need my help knowing why. The Equation of Exchange has nothing to do with the QTM.
Travis, I wrote a post on happiness rankings a few days ago, I’ll post it later this month.
22. March 2015 at 11:23
China is the elephant in the room, losing a massive 152 million workers.
Yowsa! How’s that ‘one child policy’ working out?
China’s workforce down 19%, the USA’s up 26%, that’s a 45 point gap, a net gain of 190 million workers in the USA. (There are only 140 million workers in the USA, total, today.)
That’s not looking to my eyes like this is going to become “the Chinese Century”. Maybe the 22nd will be the Indian Century.
22. March 2015 at 12:05
Brad DeLong says this is a must-read. However, I think Prof. Sumner’s thinking is a lot more insightful…..
“What Happens When US Rates Rise?” by Duncan Weldon
http://equitablegrowth.org/2015/03/21/morning-must-read-duncan-weldon-happens-us-rates-rise
22. March 2015 at 12:14
Evan Soltas wrote a new post that is getting attention:
http://esoltas.blogspot.in/2015/03/the-rent-hypothesis.html
But Kevin Erdmann wrote a better post on the same topic five months ago:
http://idiosyncraticwhisk.blogspot.com/2014/10/returns-to-capital-arent-high.html
22. March 2015 at 14:18
The McKinsey report link is a local link.
This’ll get you to it:
http://www.mckinsey.com/insights/growth/can_long-term_global_growth_be_saved
22. March 2015 at 18:19
ssumner: “Ray, The skunk at the party again. Your comment is so idiotic I can’t imagine that even you need my help knowing why. The Equation of Exchange ***has nothing to do*** with the QTM.” (emphasis added)
Wikipedia: ‘Equation_of_exchange’ (“The quantity theory of money adds assumptions about the money supply, the price level, and the effect of interest rates on velocity to create a theory about the causes of inflation and the effects of monetary policy.”)
So the subset of the Equation of Exchange, the Quantity Theory of Money, has, says Sumner, “nothing to do” with it? That’s not logical. What *is* that smell?
To his credit, if Sumner moderated his blog was like any other site, including the old Brad Delong, the current Paul Krugman, and the present Econlog, he would have banned me by now, as they all have. Nobody goes to church to hear an atheist shout that God is dead.
22. March 2015 at 18:35
BTW, the graphics for this blog on PPP are wrong. Several reasons. For one thing, PPP is not an exact science. A Cesar salad as they sell here in the Philippines is not the same (even in the same franchise, like Shakeys Pizza) as one made in the USA. The quality of ingredients and execution is markedly inferior, trust me I live here. Second, look at the blue rectangles for the USA and India. If (as I assume) the areas are indicative of nominal GDP, then the USA’s rectangle should be 3x bigger than India’s. But to me the graphic does not show the rectangle to be 3x bigger, at best it’s about 1.5x bigger. Finally, any projection based more than 4 years into the future is suspect. In this case, the McKinsey report assumes GDP is dependent on just population growth, which is a reasonable first order approximation but ignores Total Factor Productivity growth. Demographics is not destiny. All in all, a simplistic ‘coffee table’ report designed to please the eye than really engage the brain. Good optics, like the NGDPLT hypothesis.
22. March 2015 at 19:05
“The Equation of Exchange ***has nothing to do*** with the QTM”
This is astoundingly, mindblowingly wrong.
22. March 2015 at 22:20
Major Freedom:
I am going to be sorry I asked, but…
George Selgin says banks should print as much money as they want, if the market accepts the money. Ergo, a bank might have reserves of 10%, or 1%, or 0.1%.
Other Austrians say the state should regulate banks, and banks can only lend out on gold reserves, on a one to one basis. That is, $10 in gold in the vault, and the y can lend out $10.
Into which camp do you fall?
Also, you dodged the question before; If your somewhat dodgy neighbor wants to store nerve gas in his cellar, what rights do you have? That’s nerve gas, extremely lethal, not tear gas.
23. March 2015 at 03:48
Benjamin, your question to MF creates something of a false dichotomy. It’s true that I say that reserve ratios should ideally be left to the market, while noting that history shows that in such a market they might be very low, as they were in the Scottish system, for instance, where gold reserve ratios were sometimes less than 1%. But this doesn’t mean that any bank can engage in net lending of gold beyond its excess gold reserves. If a bank with only $10 of gold in the vault lend $11, it would risk default. Indeed, it would risk it by lending $10, as that would leave it with no means for meeting any random redemption request.
The error of 100% money types consists, not of arguing that banks should not lend gold they haven’t got, but of supposing that, by lending only what they have got, they would end up keeping 100% reserves. In fact, to keep 100% reserves a bank has to avoid lending altogether–that is, it must cease being a bank, and become a warehouse instead.
23. March 2015 at 04:58
Georeg Selgin: Excellent clarification–and if all free bankers were as charming as George Selgin, the would would surely be converted, regardless of the merits.
23. March 2015 at 04:58
“world would”
23. March 2015 at 05:15
Jim, I still see it as the Chinese century, but a few years back I predicted that India would be the world’s largest economy in about 50 years.
Ray, OK, now we know that you have no idea what the term “subset” means.
You said:
“If (as I assume) the areas are indicative of nominal GDP, then the USA’s rectangle should be 3x bigger than India’s. But to me the graphic does not show the rectangle to be 3x bigger, at best it’s about 1.5x bigger.”
And now we find out that Ray is also legally blind.
23. March 2015 at 06:16
O/T Scott, but have you seen Shiller’s latest interview.
Notable (for me at least) b/c he’s actually saying ‘buy’.
http://www.businessinsider.com/afp-fear-behind-current-stock-market-highs-nobel-laureate-2015-3
23. March 2015 at 11:07
take that profits of doom.
23. March 2015 at 16:03
Mark, It seems he’s suggesting European stocks but not American, is that right?
Floccina, I heard him speak in the early 1970s, in Madison, Wisconsin. In those days almost everyone agreed with him.
24. March 2015 at 11:39
“at best it’s about 1.5x bigger”
I shot it out on a projector. US blue is 1.72 times larger than India blue.
Why be surprised, it’s McKinsey… Most everything they produce belongs in the garbage.
24. March 2015 at 12:25
Derivs, No, it’s clearly about 3X bigger. BTW, The US and Indian areas are blue and tan, not just blue.
24. March 2015 at 12:50
hmm.. not sure where the heck I got the idea you were arguing over growth since ’64. 100% MY ERROR. All in, I measure 2.93 times.
But I still stand firm on the requirements for a true Ceasar dressing.
24. March 2015 at 12:57
ahhh… Ray said
“and third that he is a polemicist, even denying the size of clearly incorrectly sized blue rectangles ”
That’s why I got caught on blue. Glad I re-read that. On first read I also thought he had accused you of having several wives.
1. April 2015 at 17:33
[…] short, there is a good empirical case behind Scott Sumner’s contention that the fastest-growing economy of the 21st century will most likely be North Korea. North Korea, being an unusually […]