Archive for the Category Exchange Rates


My vision of macro

The following Venn diagram helps to explain how I visualize macro:

Screen Shot 2017-03-26 at 3.17.11 PM
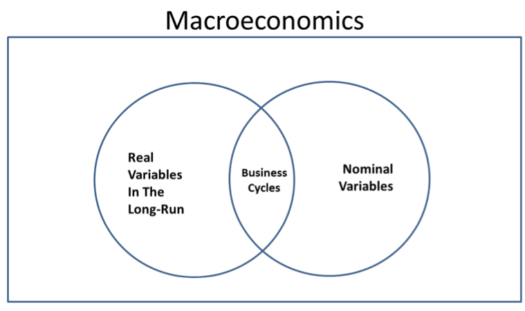
There are three basic fields within macro:

1.  Equilibrium nominal

2.  Equilibrium real

3.  Disequilibrium sticky wage/price (interaction)

I’ll take these one at a time.

1. Within equilibrium nominal there are important concepts:

A.  The quantity theory of money

B.  The Fisher effect

C.  Purchasing power parity

The first suggests that a change in M will cause a proportionate change in P.  The second suggests that a change in inflation will cause an equal change in nominal interest rates.  The third suggests that a change in the inflation differential between two countries will cause an equal change in the rate of appreciation of the nominal exchange rate.

All three concepts implicitly hold something constant; either the real demand for money, the real interest rate, or the real exchange rate.  In all three cases the concept is most useful when the money supply and price level are changing very rapidly, especially if those changes persist for long periods of time.

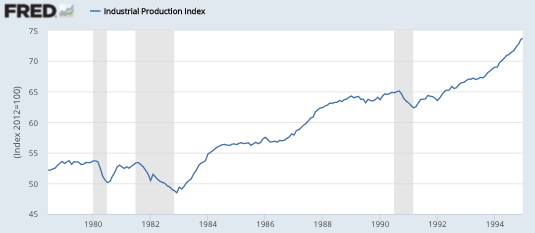
2.  Equilibrium real macro can be thought of as looking at economic shocks that do not rely on wage/price stickiness.  These include changes in population, technology, capital, preferences, government policies, weather conditions, taxes, etc.  These can cause changes in the real demand for money, the real interest rate, the real exchange rate, the unemployment rate, real GDP, and many other real variables.

3.  Disequilibrium macro looks at nominal shocks that cause changes in real variables, but only because of wage/price stickiness.  Thus because prices are sticky, an increase in the money supply will temporarily cause higher real money demand, a lower real interest rate, and a lower real exchange rate.  These changes occur even if there is no fundamental real shock hitting the economy.  The effects are temporary, and go away once wages and prices have adjusted.

If wages and prices are sticky then an increase in the money supply will also cause a temporary rise in employment and real output.

And that’s basically all of macro.  (This is how I’d try to explain macro to a really bright person, if I were given only 15 minutes.)

I also believe that understanding the implications of this three part schema makes one a better macroeconomist. Talented macroeconomists like Paul Krugman tend to have good instincts as to which real world issues belong in each category. Here’s my own view on a few examples. For simplicity, I’ll denote these three areas: nominal, real, and interaction:

1.  Most business cycles in ancient times were real, with some interaction.  The 1500 to 1650 inflation was nominal.

2.  Recessions such as 1893, 1908, 1921 and 1982 were mostly interaction.

3.  The Great Depression was all three.

4.  The Great Inflation was mostly nominal, especially in high inflation countries.

5. The 1974 recession was more “real” than usual.  Ditto for the WWII output boom.

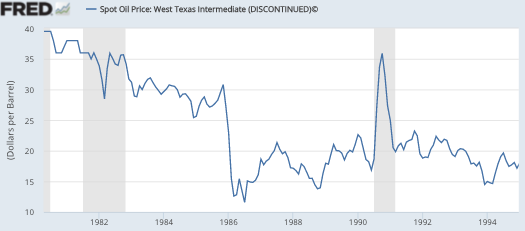
6.  The real approach works best for short run shocks to specific industries such as housing and oil, plus long run growth.  The nominal approach works best for high inflation rates and long run inflation.  The interaction approach works best for real GDP fluctuations in large diversified economies.

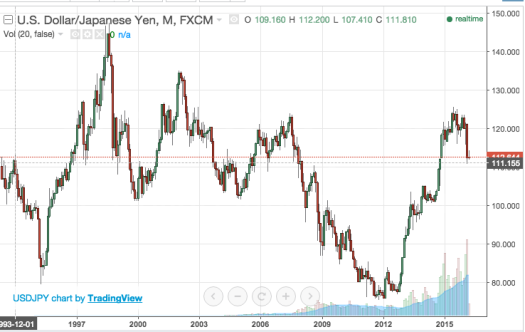
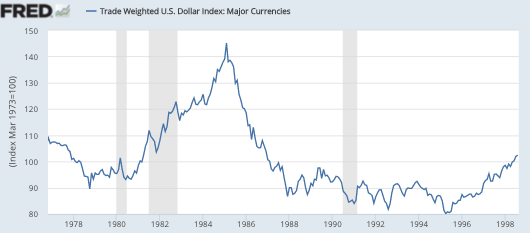
7.  If one set of economists say the Japanese yen is too strong, and another set say it’s too weak, they are probably using different frameworks.  Those who say its too strong are using a nominal framework, and are likely worried about deflation.  A weaker yen would boost inflation.  Those who think the yen is too weak are using a real framework.  Rather than worry about deflation, they worry that Japan has a current account surplus.  These views seem to contradict, but it’s theoretically possible for both to be right.  Perhaps the nominal exchange rate for the yen is too strong, and the real exchange rate is too weak.  You would then weaken the nominal exchange rate by printing money, and strengthen the real exchange rate by reducing Japanese saving rates.  (I don’t favor the latter, just saying that’s the proper implication of the misguided worry about Japanese CA surpluses.)

8.  Don’t let your policy preferences drive your analysis.  Throughout all of my life, it’s been assumed that monetary shocks drive real output by causing changes in the unemployment rate.  Not changes in trend productivity growth or population growth or labor force participation or any number of other variables.  Money matters because it affects unemployment.  If the unemployment rate is telling you that monetary policy is no longer holding back growth, the proper response is not to double down on your belief that we need easier money and then look for new theories to justify it, but rather to conclude that whatever problems we still have are now “real”, not “interaction.”

A good macroeconomist knows that all three fields of macro are very important, and which models apply to each of the three fields, and which field is most applicable to each real world macro issue.

Currency depreciation doesn’t offset tariffs

One of my few remaining thoughtful commenters (ChrisA) left the following comment:

On the UK exports being affected by tariff’s after Brexit – couldn’t that be taken care of by a fall in the pound vs the Euro? I don’t actually think a tariff war between the UK and the EU is actually going to happen, since the trade deficit is so much in favour of the EU they have a strong incentive to be sensible. But even in the worst case we couldn’t be talking about tariffs of more than 10%, which is easily taken care of by the fall in the pound that has happened over the last week. And remember that applies to all of the exports of the UK to all of the world, not just to the EU.

I see this claim quite often, but it doesn’t hold up to close scrutiny.  Tariffs on imports are essentially a tax wedge on trade, which reduces both imports and exports.  When people talk about using “currency depreciation” as a policy tool, they are often referring to an expansionary monetary policy.  However, although monetary stimulus does reduce the nominal exchange rates in both the short and long run, it only reduces the real exchange rate in the short run, until wages and prices have adjusted.  After that, the price level rises to restore the previous real exchange rate.

There’s no getting around the fact that trade barriers make economies less efficient, by diverting output from the tradable to the non-tradable sector.  This conclusion is not affected by whether the UK has a trade surplus or deficit, so I don’t agree that the EU has an “incentive to be sensible”.  Indeed, an import tariff might well reduce exports by just as much as it reduces imports, even if one’s trading partners do not retaliate.

Some commenters also criticized claims of a skilled labor shortage in Spain.  Over at Econlog, I have a new post that explains why they are wrong.

Borat in Hawaii

One of the most interesting things about the long Japanese deflation was the relative stability of the Japanese yen, against the dollar.  It’s depreciated about 1% since the end of 1993:

Screen Shot 2016-03-08 at 4.29.39 PM

You’d have expected the Japanese yen to have appreciated strongly in recent decades, as the US price level (GDP deflator) has risen from 73 to 100 since early 1994, while the Japanese price level has fallen from 117 to 100.  Thus the ratio of US to Japanese prices has risen from 0.91 to 1.62. And that’s not because I cherry-picked the data, as of a month ago the yen was down about 10% against the dollar, since the end of 1993.  Thus the deviation from PPP would have been even bigger.

I frequently argue that inflation doesn’t matter, what matters is NGDP growth per capita.  Here is the NGDP of Japan since the beginning of 1994:

Screen Shot 2016-03-07 at 10.13.01 AM

It’s up about 1%.  But Japan’s population is up about 1% or 2%, depending on the source, meaning that NGDP/person is either flat or down 1%.

How about in the US?  The following graph shows NGDP/person:

Screen Shot 2016-03-07 at 10.18.40 AM

So in the US NGDP/person is up about 106.7%, versus at most zero in Japan. You might say that’s comparing apples and oranges, as one is in dollars and the other is in yen.  But as we saw the exchange rate is pretty stable since the end of 1993.  On the other hand, if PPP does not hold, what difference does that make?  RGDP in Japan has been rising, so Japanese living standards are on the way up.

Here’s how I would interpret this data.  This is telling us that compared with early 1994, Japanese tourists have become much poorer in a relative sense, every time they visit Hawaii.  Relative to American tourists, they have a hard time affording positional goods, like the best hotel rooms.

Just think about the size of this relative impoverishment of Japanese tourists.  In PPP terms, Japan’s per capita GDP (World Bank) is $36,426, a normal developed country.  What does it mean to lose half your purchasing power?  Here are some countries about half as rich as Japan:

Screen Shot 2016-03-07 at 10.10.16 AMPlease don’t misunderstand me; I’m not saying that Japan is that poor, the $36,412 figure shows their current PPP income.  I’m just trying to give you a sense of how big a drop it is.  In fact, at the end of 1993 the yen was quite strong in real terms, so the Japanese seemed rich when they visited Hawaii.  But since then, the drop has been precipitous, with Japanese tourists losing over half their purchasing power, relative to Americans.

One silver lining is that Japan remains 50% richer than Borat’s home country (Kazakhstan) which has a GDP/person of only $24,228, so I don’t expect to see any Japanese tourists confusing the elevator with their hotel room.

Finally, I get to the point.  The PPP theory is pretty elastic, but not infinitely so.  The fall in the real value of the yen is probably close to the maximum possible.  If Japan were to simply to push the yen back to 125/dollar, and then peg it for several decades, they would likely experience at least as high an inflation rate as the US, probably higher.  Because the US is now out of the zero rate trap, I predict our inflation rate will average at least 1.5% over the next few decades.  If Japan doesn’t end up with significant inflation, it won’t be because they are unable to do it with monetary policy alone.  Rather it would be because they stupidly allowed the yen to appreciate over time.  It’s up to them.  The US may grouse, but as we showed with the Chinese dollar peg, we are (Thank God!) a paper tiger.

And if I’m wrong, and the real yen exchange rate keeps plunging, then Japanese workers will have Kazakhstani wage by 2040.  If those highly productive Japanese workers can’t take market share at Kazakhstani wage levels, then Japan should just fold up shop.

Is it 1985-86 again?

See if this sounds familiar. Halfway through a long expansion, industrial production levels off, after years of rapid growth. This is blamed on two factors, declining oil prices and a strong dollar.  I could be describing the past year, or I could be describing 1985-86:

Notice how industrial production leveled off for a couple years, before resuming its rise:

Screen Shot 2016-02-02 at 1.01.16 PMAnd here is the oil price, which fell gradually in the 1982-85 period and then plunged in 1985-86:

Screen Shot 2016-02-02 at 1.00.55 PM

And here is the trade-weighted dollar, which soared in value, and then plunged:Screen Shot 2016-02-02 at 1.00.42 PM

My hunch is that the dollar was more important than oil.  Tight money led to a slowdown in NGDP growth and a strong dollar.  NGDP growth (year over year) slowed from 12.4% in 1984 Q1, to only 4.9% 1986 Q4. Eventually the Fed eased policy, and NGDP accelerated.  The 1980s boom resumed.  It actually eased a bit too much in the late 1980s, which set up the 1990-91 recession.

Does this mean that history will repeat? No. But it’s an interesting comparison.

PS.  While writing this I forget that Caroline Baum made a similar observation in her book “Just What I Said“, where she pointed out:

This isn’t the first time that a change in oil prices has been regarded as a tax increase or tax cut and anointed with the ability to help or hinder economic growth. Time-trip back to early 1986, when oil prices plunged to $10 a barrel in April from $30 at the end of 1985. This was hailed as good news – a tax cut! – for consumers, which was guaranteed to boost US economic growth.

It didn’t turn out that way.  Following the plunge in oil prices, gross domestic product growth slipped to an anemic 1.7% in the second quarter of 1986 . . .

Ah, recall the days when 1.7% RGDP growth was anemic, not above trend.


Some thoughts on “overvalued” and “undervalued” exchange rates

Benn Steil and Emma Smith have a new post on the Big Mac Index:

The Economist magazine’s famous Big Mac Index uses the price of McDonald’s Big Macs around the world, expressed in a common currency (U.S. dollars), to estimate the extent to which various currencies are over- or under-valued. The Big Mac is a global product, identical across borders, which makes it an interesting one for this purpose.

But burgers travel badly.  So in 2013 we created our own index—one that better meets the condition that the product can flow quickly and cheaply across borders.

The Geo-Graphics Little Mac Index compares the price of iPad minis across countries. iPad minis are a global product that, unlike Big Macs, do in fact travel the earth with their owners.

.  .  .

Overall, the Little Mac Index suggests that the dollar has become slightly more overvalued (up from 5 percent) since the beginning of 2015.  The euro is undervalued by 11 percent, and the yen by 10 percent.  Having been fairly valued at the beginning of last year, the renminbi – following on the heels of China’s large devaluation in August – is now 5 percent undervalued.  This compares with an implausible 46 percent undervaluation on the Big Mac Index.  Maybe Congress is Lovin’ It, but we think the Economist needs to hold the mustard.

Given recent events, only a complete moron, or Donald Trump, would claim the yuan is undervalued.  So that’s a point in favor of the Little Mac Index.  But let’s step back and think about what terms like ‘overvalued’ and ‘undervalued’ actually mean.  Do they mean the exchange rate is artificially set at a different level from the black market rate?  Perhaps in cases like Venezuela, but in most cases these are actual market exchange rates, where you can freely buy and sell the currency in question.  So clearly that’s not what the creators of the Big Mac and Little Mac indices have in mind.

But then what does it mean to say an asset price is under or overvalued?  Does it mean the market is in some sense wrong, as when there is a bubble?  Perhaps, but then why would you expect these “Mac” excises to find the right exchange rate? Yes, PPP predicts a certain relationship between prices, but we have very good economic theories, such as Balassa/Samuelson theory, which explain why we should not expect PPP to hold for all goods.  So a deviation from the prediction of PPP actually tells us nothing about under and overvaluation.

Nor is it clear why Steil and Smith think it’s better to use a traded good than a non-traded good.  Let’s take that to the logical extreme, and use a good that is so easily traded that the law of one price holds, say gold.  AFAIK, the price of gold in New York, London, Hong Kong, Tokyo, Zurich, etc., is virtually identical, when measured in a common currency.  So Steil and Smith have picked a good that is more easily traded that Big Macs, but less easily traded than gold.  But why is that optimal? Using gold, PPP would always seem to hold true.  Even worse, a sudden adjustment in the exchange rate (such as Switzerland’s 15% appreciation a year ago), would leave the price of gold in Zurich exactly the same as before, when measured in dollar terms.  In other words, if they had chosen a very easily traded good like gold, instead of Little Macs, Steil and Smith would have found the Swiss franc to be correctly valued right before, and right after, a sudden 15% adjustment.  Does that make sense?

It seems to me that if you really want to look for exchange rates that are out of line with PPP, you’d use non-traded goods like Big Macs, not traded goods like gold. Little Macs fall in between, and offer no obvious advantage over either extreme.

In my view all of these exercises miss the point.  Exchange rates should not be set to make PPP come true. Nor should exchange rates be set to generate a current account balance of zero.  Trying to set rates to make these equalities hold would create a macroeconomic disaster.  Exchange rates should be set at a level that provides macroeconomic equilibrium, something like low and steady growth in NGDP.  The only meaningful sense that an exchange rate can be said to be overvalued is if it leads to below target NGDP growth (or inflation, if you prefer.) For instance, despite falling from 80 to the dollar, to 120 to the dollar, the yen is still overvalued, as most experts forecast about 1% inflation going forward, which is below their 2% target.

This sense in which an exchange rate can be overvalued is exactly the same as saying the short term interest rate is too high, or the TIPS spread is too low, or the nominal price of zinc is too low.  A counterfactual monetary policy that produced on target NGDP growth, would (by assumption) lead to a lower short-term nominal interest rate, a higher TIPS spread, and a higher nominal price of zinc.  And a lower domestic currency value in the forex markets.  That doesn’t mean the market is “wrong” in a “violation of the EMH” sense, rather it means monetary policy is too tight to achieve macroeconomic equilibrium.

So far I’ve talked about nominal exchange rates.  But what about real exchange rates, can they also be overvalued or undervalued?  Elsewhere I’ve argued that real and nominal exchange rates are so different that they should not even be discussed in the same course.  And yet many people foolishly talk about them synonymously. What would it mean to say the China’s real exchange rate is undervalued?  In that case you’d be arguing that China’s government policies encourage too much saving, too little investment, or both.  In other words, the policies encourage too big a S-I gap, which of course is the current account surplus.  I’m not saying that’s true (I doubt it) but that would be the argument.  In that case it would be stupid to adjust the exchange rate (doing so would produce a depression) you’d want to change the saving/investment policies.

Off topic, I love the ambition in this post by C. Harwick, where he derives NGDP targeting from first principles.  I don’t know anything about this blogger, but based on this post he seems much younger and much smarter than I am.  However I disagree with the final two bullet points in item #13.

PS.  I have a new post on IS shocks, over at Econlog.