

Australia’s Great Stagnation
It looks like the Great Stagnation has hit even Australia. In an earlier post I pointed out that Australian NGDP rose at a 6.5% rate from 1996:2 to 2006:2. Then we had the Global Financial Crisis, and Australian NGDP growth slowed to . . . er . . . it stayed at 6.5% from 2006:2 to 2012:2. No tight money and no recession in Australia.
In the 11 quarters since 2012:2, NGDP growth in Australia has slowed to a 2.5% rate. Why? And yet still no recession. Why not?
I’m not quite sure. One factor is the slowdown in global commodity markets. Australian RGDP growth has been a respectable 2.4% rate over those 11 quarters. So I wonder if it’s falling prices of commodity exports that are holding down GDP inflation. (Which has average a bit over 0.1%.) Further support for this idea comes from the Australian CPI, which has averaged about 2.3% inflation, right in the government’s 2% to 3% target range. Although GDP inflation often runs a bit below CPI inflation, that’s a huge gap. Could it be falling iron and coal prices?
For these reasons I occasionally suggest that total compensation might be a better metric for a commodity-intensive economy. Unfortunately the Australian data doesn’t seem to support my theory, with total compensation only rising about 2%/year since 2012:2. So I’m perplexed.
Mystery one: Why is RGDP holding up when NGDP is so weak? (That might be falling commodity prices.)
Mystery two: Why have they avoided recession with such weak growth in total comp?
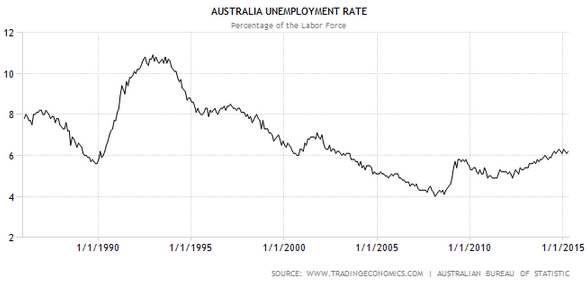
Let’s compare Australian unemployment with Canadian unemployment. First Australia:
 Then Canada:
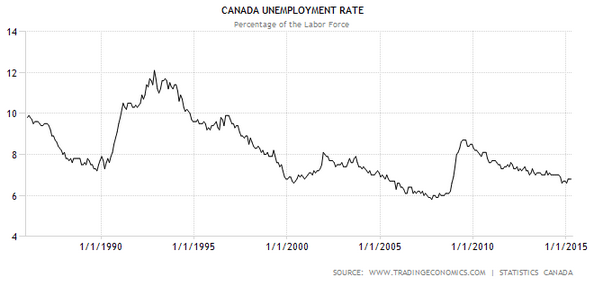 Surprisingly similar. Canada had a recession in 2008-09, and Australia just barely avoided one. Why? In Australia’s case they were helped by two factors. They were in an overheated boom in early 2008, so the modest rise in unemployment just brought the rate back to “normal.” And second, they have the highest trend rate of growth among the developed (white) nations, due to high immigration. So they only had one negative quarter. But as you can see, unemployment in Australia during 2008-09 rose only a bit less than in Canada.
More recently, Australia’s followed the European trend of higher unemployment since 2012, while Canada has followed the US downward trend. Canada has had 3.0% NGDP growth, a bit more than Australia. Factor in Canada’s slower population growth, and that largely explains the better jobs numbers. On the other hand, Canada’s only had 2% RGDP growth since 2012:2, even less than Australia. Both countries are presumably experiencing wage moderation. And both countries have seen especially weak NGDP growth in the last year (presumably due to weak commodity export prices) with RGDP outperforming NGDP.
The outlook for Australia is reasonably good, as long as the central bank keeps CPI inflation in the 2% to 3% range. In the past 6 months it’s fallen below that range, and they need to ease monetary policy a bit. The unusually wide gap between CPI inflation and GDP inflation should narrow over time, which means faster NGDP growth as long as they keep CPI inflation in the 2% to 3% range. But the days of 6.5% NGDP growth are over—Australia’s also in a Great Stagnation.
My prediction is that 4.3% NGDP growth is Australia’s new normal, 2.5% real and 1.8% GDP inflation. CPI inflation will average just over 2%.
HT: Stephen Kirchner
Tags:
6. June 2015 at 08:37
Mouth bet by Sumner noted. Sumner not only is an expert on the environmental effects of the American beaver, he has a crystal ball on the Australian economy. Such a genius! Akin to the Roman emperor Nero.
6. June 2015 at 11:01
From my Feb 2014 Columbia presentation (slide 18):
Total spend since 2005 through 2013 on upstream exploration and production: $4 trillion
-Of which, $350 bn on US and Canadian unconventional oil and gas…
-…and another $150 bn on LNG and GTL
-$3.5 trillion was spent maintaining the 2005 legacy oil and gas system
-About $2.5 trillion* was spent on legacy crude oil production””94% of the petroleum liquids supply today.
-Result: legacy oil production has fallen by 1 mbpd
-Peak oil for legacy system: still 2005
-For comparison: ’98-’05, $1.5 trillion spend added +8.6 mbpd crude production
-Compared to ’98-’05 period, vaporized GDP of Germany
* GDP of Germany is $3.5 trillion
http://energypolicy.columbia.edu/sites/default/files/energy/Kopits%20-%20Oil%20and%20Economic%20Growth%20%28SIPA%2C%202014%29%20-%20Presentation%20Version%5B1%5D.pdf
6. June 2015 at 12:08
Ray, Actually your decadent lifestyle reminds me a bit more of Nero. But Nero knew that when a blue box goes behind a red box, the blue box is still there.
Steven, Any comments on this post?
6. June 2015 at 16:54
I don’t know if you’re aware of this, but most of the ‘intellectual’ economic discussion is pushing us for a Swedish style regime of bubble… suppressing?
http://www.afr.com/real-estate/residential/housing-bubble-compels-rba-to-hold-rates-at-225pc-20150407-1mfyvh
http://www.smh.com.au/business/banking-and-finance/rba-sounds-alarm-about-bursting-of-housing-bubble-inflated-by-cheap-credit-20150325-1m7njx.html
When in truth, it’s localised to just high-end Sydney. It’s crazy. Please draw more attention to it.
6. June 2015 at 16:57
Maybe I’m being overly optimistic, but I’d be very surprised if the RBA allowed the trend rate of inflation to fall to 2%. Since their adoption of their inflation target they’ve essentially had a policy of 2.5% Inflation level targeting (as opposed to the Fed/ECB’s 2% inflation ceiling). Allowing the trend to shift to 2% would constitute a shift in policy regime.
“My prediction is that 4.3% NGDP growth is Australia’s new normal, 2.5% real and 1.8% GDP inflation. CPI inflation will average just over 2%.”
Add 0.5% to inflation and NGDP growth and you have my estimate.
6. June 2015 at 17:27
Excellent blogging, fascinating comparisons. While I prefer a robust NGDP target, an IT band of 2.5% to 3.5% might obtain nearly the same results.
The Aussie central bank probably should shoot for the higher end of its IT band, or even overshoot for a few years due to weak commodity prices.
6. June 2015 at 19:17
Strayan here. Australia narrowly avoided recession in large part due to Chinese stimulus which kept our key exports propped up.
6. June 2015 at 20:03
Interestingly, that’s about when the drought officially ended.
http://en.wikipedia.org/wiki/2000s_Australian_drought
They have about the same population as Texas but are about ten times larger, so being positioned next to the greatest concentrations of humanity you’d think they’d be well-positioned for resource exploitation.
6. June 2015 at 21:36
Scott,
Can you write a post explaining what you by The Great Stagnation and the policy implications for this? How do developed governments respond to this? How do developing governments prepare for this?
Cheers.
7. June 2015 at 05:11
Colin, My God! Do these people never learn?
Oliver, Perhaps, but their recent policy is difficult to explain if they were still shooting for 2.5%. (Just as Fed policy is difficult to explain under the 2% assumption.)
CMA, You’d expect huge commodity exporters to have more recessions, not fewer. And yet Australia has not had a recession since 1991. So while you might be right about 2008-09, their longer term success can more easily be explained via sound monetary policy.
Apisith, I don’t think the Great Stagnation has any obvious policy implications. As always there are many supply side reforms to boost growth that the government should do, but that’s true whether you are in a great stagnation or not. Number one being MORE IMMIGRATION.
7. June 2015 at 05:56
Sumner: “Number one being MORE IMMIGRATION.” LOL, spoken by a true Boston Brahmin, who is a limousine liberal and believes in both NIMBY and more immigration. After all, even and especially rich folk need more immigrants to clean their homes and SoCal pools even more cheaply. In the alternative, poor Sumner (literally and figuratively) believes in the simplistic single solution remedy of ‘more X’, along the lines of: “print more money” (for more GDP), “more education”, “less government regulations”, “lower taxes”, “abolish the double corporate tax”, “less antitrust enforcement”, and the like.
But none of these things would help if there is a Great Stagnation, a point that escapes our resident decadent genius (“Apisith, I don’t think the Great Stagnation has any obvious policy implications”). All hail Scott Sumner! World’s smartest man, the blogger that saved the world.
7. June 2015 at 12:01
So, from a commodities perspective, things look like this:
First, let’s start with coal and iron ore, the top 2 Australian exports. These saw a roaring decade behind rapid growth in China. In fact, if you look for one of the key determinants of GDP growth in the last decade on a country level, one of them is physical proximity to China. Australia has that.
How important is China? In the five years from 2002-2007, China added a US equivalent of coal consumption, and added another US equivalent in the next five years as well. That’s a lot of coal–and Australian benefited greatly.
In addition, this earlier phase of China economic development–pertaining to roads, airports, ports and railroads–was highly steel intensive, and this made for a decade of terrific iron ore exports, not only from Australia, but from, say, Brazil as well.
However, it was pretty clear that, when China hit the top of the infrastructure development curve (which I think I and others earlier predicted for around 2015), we would see a big recession in the coal and iron ore industries, as supply growth outran demand growth. And we’re seeing that now. Neither coal nor ore were fundamentally constrained commodities–it just took a while for supply to catch up to simply enormous Chinese (and indirectly, China-derived) demand. But I think the go-go days are over. How do you say ‘Allentown’ in Chinese?
The coal and ore cycle started turning maybe 18 months ago (something like that), and with it, the terms of trade for exporters like Australia and Brazil.
Oil and gas are a bit different. These are later stage commodities. Oil is related to transportation (car ownership), and gas to gas-fired power plants (which are more expensive but cleaner than coal plants). The big surge in oil and gas consumption comes after the surge in coal and ore consumption.
In the last year, we see a cyclical (but not structural) decline in Chinese oil demand growth in 2014 and a simply amazing surge in the US shale oil supply, leading to an oil price collapse (and a reversion to demand-constrained economics).
As for oil, during the supply-constrained period, there is a price, the ‘carrying capacity level’, above which the marginal consumer would rather consume less than pay more. And that’s somewhere in the range of $115 / barrel (cc 5% of global GDP).
We hit that carrying capacity level in early 2011, with the Arab Spring, and the oil price did not fall meaningfully below carrying capacity level for the next three years. However, once you’re at the carrying capacity price–and this is important–the market will not recognize increasing costs. Alas, the cost of producing oil continued to rise after 2011, but it was pretty clear to me at the time that oil prices would not rise further very fast. Hence, my forecast for capex compression as oil companies were caught between rising costs and stagnant revenues.
Thus, after 2011, we can see terms of trade, even in oil and gas, plateau and begin to move against hydrocarbon exporters like Norway and Australia–albeit from high levels (ie, the Aussie dollar and Norwegian kroner remained strong).
More recently, low oil and gas prices are now leading to material adjustments in both oil supply and demand. Some think clearing the market will take a couple of years; I am closer to a few months (for reasons which I will detail in an upcoming report in which I review Goldman Sachs’ recent 420 Report on top global oil projects).
Now, as oil and gas are later stage development commodities (ie, they come after coal and gas), we are still ahead of the big surge in demand that we saw for coal and gas. (In this, my view diverges from almost everyone else’s in the industry.)
For example, Korea was at approximately the same stage of development in 1986 that China is today. After the oil price collapsed in 1986, Korea’s oil consumption doubled over the next five years. Today, that would equal annual consumption growth of 2 mbpd / year, just from China. For purposes of comparison, Goldman sees total annual demand growth of 1.2 mbpd globally in total over that period. We do know that China can add consumption of a US equivalent of a commodity in five years–it’s done so twice recently. China’s adding 2 mbpd over the next five years would equal only 60% of US oil consumption, ie, China could in theory do that and more.
Therefore, I think we will see strong oil demand (in fact, we’re already seeing it), in a magnitude considerably greater than currently expected by most experts. Competitive oil exporters will see terms of trade recover.
However, this may not help Australia or Norway very much. Right now, the large capex projects–like the big LNG project in Australia and most of the North Sea–are at the top of the cost curve, with US shales below them. Thus, a recovery in oil demand and prices will principally help US shale producers–I am forecasting a hard re-start for the sector in Q3. At the same time, the high capex (IOC) sector may get squeezed, and that means both Norway and Australia are likely to struggle. Goldman has put “sells” on the IOCs for just this reason.
The US, by contrast, could see a period of economic prosperity unlike any since the early 1970s, as US shale production regains rapid growth and the US oil trade deficit effectively disappears over the next four years. Put another way, we could see both reasonable oil prices and rapidly increasing US oil production through 2018 or so. We may have a chance to be the rich and arrogant Americans once again.
I, for one, am looking forward to it.
7. June 2015 at 21:52
@Sumner
Regarding the articles Colin posted:
The AFR has been pushing an anti rate cut agenda for years now, but most of the “economic debate” regarding the housing bubble in the mainstream media has been about negative gearing.
For the most part we here in Australia escaped the monetary policy debate because we’re still well above the ZLB and the RBA never had a QE program, so all of the public’s attention was focussed on fiscal policy and the budget deficit. People only started paying attention to what the RBA was doing when rates were cut to the record lows of 2.25% late last year and then 2.00% in May.
8. June 2015 at 06:17
Why has Australia hit the Great Stagnation? If their biggest exports are commodities, then is any surprise then? In the case of Texas slowing down, there is no mystery here. (I not saying they are doing any thing wrong.)
In terms of Global Growth, it appears the Great Stagnation has conquered commodities and inflation in the developed world. I think it is a combination of current productivity is not hitting GDP (via Krugman and we are companies are investing ‘less’ money in software but getting more) and the Baby Bust of develping rich nations. Without a growing population, how can you raise AD curve?
8. June 2015 at 10:30
Ray, Yup, I’m a big believer in NIMBY.
Collin, But why is Australian inflation and labor comp growth slowing? You can’t explain that with real factors.
You asked:
“Without a growing population, how can you raise AD curve?”
Um, print money?
9. June 2015 at 14:05
[…] This post was motivated by Scott Sumner´s musings about Australia: Australia´s Great Stagnation: […]