

A question for New Keynesians
As you know, I often argue that inflation doesn’t play a useful role in macroeconomics. In places where economists put inflation into their models, NGDP growth would be much more useful. Obviously lots of people don’t agree with me, and this post is aimed at those people. Here’s my question:
Which inflation rate is appropriate in NK models? The average change in the price of goods sold, or the average change in the quality-adjusted price of goods sold? I.e., according to NK theory, what role should hedonics play in the construction of price indices? Why? What specific aspect of the NK model points to the need for a specific hedonic adjustment?
I hope it goes without saying that in NK models there is no role for the concept of a price index that in some sense accurately reflects changes in the ‘cost of living’, whatever that nebulous terms means. So then what is the optimal price index, according to the NKs? In addition, how would your optimal index treat the cost of housing? What about monthly payments made under long-term rental agreements? Are they “prices”? How about payments made to pay off long-term car loans? Are they “prices”? (Hint: The BLS treats apartment rents as prices, but not payments on car loans.)
In other words, what the hell is this “inflation” concept (which you think is so important) actually trying to measure?
Second hint: Think about things like menu costs, and then also think about how they relate to the way the government actually measures the (quality-adjusted) cost of living.
I’m not worried about perfection—I understand that no data series are perfect. I’m just trying to figure out what you think “inflation” should be trying to measure, in a perfect world. In case my question still is not clear, suppose there were no new products being invented, but existing products rose in price at 4% per year in unit terms, and 2.5% per year in quality-adjusted terms. That’s because the quality of each product improved at 1.5% per year. In that case, which inflation number belongs in NK models, 4% or 2.5%?
PS. I have a new post at Econlog.
Update: Roger Farmer has an interesting comment below, which discusses his version of what I call the “Musical Chairs” approach to macro. Thus I thought it might be a good time to update the graph:
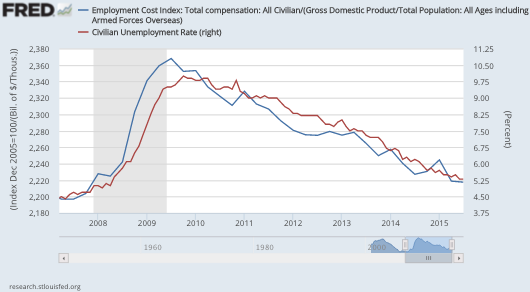
Yup, it’s still working fine. Indeed most of the variation probably reflects measurement errors. If nominal wages are very sticky (and they are) then NGDP shocks largely explain variations in the unemployment rate.
The graph shows wage rate/(NGDP/population) in blue and the unemployment rate in red. The wage rate is actually total compensation per hour.
Tags:
1. January 2016 at 20:01
BTW, Scott, this was my response to you on Marginal Revolution, since Cowen keeps deleting it:
You are obviously correct, Scott, and especially so in your first claim. Fiscal tightening in 1937 was primarily about taxes and transfers. But the first one I noticed was Williamson dividing real investment by real GDP to find the investment rate. Everyone knows that you find the investment rate by dividing nominal investment by nominal GDP, which shows an entirely different result. BTW, I’m now reading your book. It’s written kinda dry, and way more serious than your blog.
And here are my 110 predictions for this year:
https://againstjebelallawz.wordpress.com/2016/01/01/110-predictions-for-december-31-2016/
1. January 2016 at 20:16
More questions than answers from Sumner, though I suspect all the questions are loaded. A simple answer: NK don’t exist anymore. People have moved on from simplistic “one variable” models like NGDPLT or NK (‘ratex’ + ‘sticky wages/prices’). We’re in a new age where it’s understood prices and wages are more flexible than previously believed, and, as Shiller won his Nobel over, economics is largely irrational impulses (‘animal spirits’) with a dash of game theory ala Kahneman.
@E.Harding- why you post at a biblical website and expect Sumner to follow it? He’s your boy? You are an apt pupil it seems.
1. January 2016 at 20:33
Putting my New Keynesian hat (back) on…
The “inflation rate” enters the NK model in three places:
1. In the IS curve, where you need to subtract the inflation rate form the nominal interest rate to get a real interest rate. For a simple consumption only model, I think this should be a quality-adjusted inflation rate, because if you think quality will be higher next year, you would be likely to postpone consumption. With investment in the IS curve too, you would want to pay attention to the inflation rate on capital goods (quality-adjusted).
2. In the Phillips Curve. Here you would might want to pay attention to the fact that some prices are stickier than others. Core vs headline etc.
3. In the monetary policy reaction function. Whichever inflation rate the central bank actually targets.
1. January 2016 at 20:38
“why you post at a biblical website”
-It’s mostly not these days.
“and expect Sumner to follow it?”
-I don’t. I’m just linking to my predictions. I didn’t type them all for noone to read them!
“We’re in a new age where it’s understood prices and wages are more flexible than previously believed, and, as Shiller won his Nobel over, economics is largely irrational impulses (‘animal spirits’) with a dash of game theory ala Kahneman.”
-Riiiiiiiiiiiiiiight.
1. January 2016 at 20:58
As you know, I often argue that centralized counterfeiting operations do not play a useful role in macroeconomics. In places where economists put NGDP into their models, competition in money would be much more useful. Obviously lots of people don’t agree with me, and this post is aimed at those people. Here’s my question:
Which NGDP rate is appropriate in MM models? The average change in real output plus 2%? The average change in price inflation plus 3%? I.e., according to MM theory, what role should profit and loss play in the construction of money printing rates? Why? What specific aspect of the MM model points to the need for a specific NGDP rate?
I hope it goes without saying that in MM models there is no role for the concept of market signals that in some sense accurately reflects changes in ‘demand for money’, whatever that nebulous terms means. So then what is the optimal NGDP growth rate, according to the MMs? In addition, how would your optimal rate treat economy wide malinvestment that requires variable NGDP to correct? What about market driven NGDP deflations? Are they “central bank failures”? How about deflationary corrections to incorrect NGDP growth rates? Are they “central bank failures”?
In other words, what hell of a problem is this “central bank” concept (which you think is so important) actually trying to solve?
1. January 2016 at 21:04
@Freedom
Well, as Sumner said, the growth rate shouldn’t be too high to avoid excessive capital taxation. But it shouldn’t be too low, to avert wage and price rigidity. The growth rate in the labor force+4% should do it. It certainly worked well in the 1990s. Money’s neutral in the long run, anyway, so it shouldn’t matter too much. The economy-wide malinvestment can be corrected via high inflation, as in most of the former Soviet republics in the 1990s.
“In other words, what hell of a problem is this “central bank” concept (which you think is so important) actually trying to solve?”
-Unemployment. Unstable RGDP. Stuff like that.
1. January 2016 at 21:05
@N. Rowe- you made some typos, [corrected]:
“Putting my New Keynesian hat (b[l]ack) on…”
“subtract the inflation rate form [sic, ‘from’] the nominal interest rate”
But you fail to notice Sumner’s questions are rhetorical, loaded questions. He has no interest in learning something new (and it beggars the mind to think Sumner doesn’t know your elementary explanations, though I suppose with Sumner that’s possible). The hints are here: (Sumner) “I hope it goes without saying that…” (implies the answer is obvious), “hell” (swear words never used in serious science posts, though Sumner claims economics journal articles contain inside jokes, then again economics is not serious science), “Second hint” (presupposes an answer that only Sumner knows). In fact, as you implied, NK models don’t use historical data, due to the Lucas Critique, but instead use occult (hidden) variables, akin to Sumner’s beloved Wickesian (sic) natural rate. As such, NK models are bogus unless they can predict the future. And I’ve not seen that they can (please correct me if I’m wrong).
@E. Harding -ok, thanks. You still need to get rid of those annoying snowflakes on your website. It’s as if you’re telling the reader: ‘I’m just a troll, this whole blog is a joke…’ – unless that’s your intent?
1. January 2016 at 22:04
@Ray
-I wouldn’t be troubled by people getting that impression from the Marginal Counterrevolution. But from Against Jebel al-Lawz? That would be seriously concerning to me.
2. January 2016 at 06:56
Why people keep assuming quality will go up next period? Quality may and often goes down…just as frequently as go up.
2. January 2016 at 07:32
E. Harding, Yes, the book was aimed at academics, not the general public.
Nick, My biggest concern was the question of which inflation rate did the NKs think the central bank should target. As you point out, that might be the stickier index. But is the stickier index quality-adjusted, or not? How would a NK measure the cost of housing?
On the IS curve, is it possible that income and substitution effects push in the opposite direction, or are you holding real income constant when you contemplate a faster increase in quality?
2. January 2016 at 07:46
E Harding:
“the growth rate shouldn’t be too high to avoid excessive capital taxation. But it shouldn’t be too low, to avert wage and price rigidity.”
Define “excessive” taxation. Define “rigidity”.
Looking for a non-NK-arbitrariness to the answers, because apparently MM does not use fuzzy, subjectivist concepts like “inflation”. Apparently these terms “excessive” and “rigid” are pin point accurate and not arbitrary at all.
“The growth rate in the labor force+4% should do it. It certainly worked well in the 1990s. Money’s neutral in the long run, anyway, so it shouldn’t matter too much.”
So any number, below or above labor force growth plus 4% is fine after all.
Yup, MMs really do have the moral high ground for non-arbitrariness. They are the best folks to teach those arbitrary NKs a lesson.
“The economy-wide malinvestment can be corrected via high inflation.”
Please explain how malinvestment caused by inflation can be corrected by more inflation.
“Unemployment. Unstable RGDP. Stuff like that.”
I was actually asking for evidence backed problems, not an ex post rationalization of figments of one’s neurotic imagination that is itself a cause. Thought that went without saying…apparently not.
MMs are so accurate and non-arbitrary. Only one throw at a dartboard and praying for money neutrality to sublimate in the long run.
Kumbaya, praise the lord.
2. January 2016 at 08:41
Scott,
You should watch the movie the Big Short. Reminded me of a conversation you and I had months ago when you were blaming the Fed for the debacle of 07-08 and I mentioned it was actually a crisis of confidence that led to a complete global credit seizure. Which you then blamed the lack of confidence on the Fed – to which I just rolled my eyeballs to and went to play with my dogs…
Was also fun watching a movie where you get to watch men talk to one another the way men are intended to speak to one another… “cough cough.. “it was written for academics”..lol, hard to understand why you went on your first date at what age??????
2. January 2016 at 08:57
Derivs, I never blamed the Fed for the debacle of 2007-08, I blamed them for the recession of 2008-09. The distinction is crucial. In the clips for the film they seem to believe there was a big housing bubble, which would inevitably burst. Do they explain why the British, Canadian, Australian and New Zealand bubbles (all quite similar) never burst? If so, I’ll go to see the film.
2. January 2016 at 09:14
Derivs – the recession, along with dollar demand from Europe, caused the financial crisis, not the either way around. The US went into recession in December of 2007, and the periphery of Europe had gone into recession in Q2 of 2007. Try to keep your timelines correct – hating on the financial sector in the US may seem like fun, but when a problem is misdiagnosed the solution to said problem will likely be incorrect. You can ask the unemployed youth of southern Europe about that.
2. January 2016 at 10:09
Scott
I am happy to go along with the use of NGDP growth to replace inflation. I have a question for you. Should a small scale model (be it NK or my own preferred animal spirits model) include a concept of real economic activity? If so: should it be real GDP, unemployment, or aggregate hours worked per member of the population?
Real GDP introduces your indexing conundrum in a different form since we need an index number to define ‘real’. My answer to that issue is to deflate NGDP by a measure of the money wage defined as compensation to employees divided by full time equivalent employees from the NIPA accounts. You will recognize that measure as an attempt to get at Keynes” discussing of units in chapter 4 of the GT.
Roger
2. January 2016 at 10:48
Roger, Ideally in the Musical Chairs approach the output indicator should be aggregate hours worked per member of the population, or perhaps per working age member.
It’s interesting that you mention Keynes’s Chapter 4. I recently did a post pointing to similarities between the GT and the Musical Chairs approach:
http://www.themoneyillusion.com/?p=30854
Your way of deriving RGDP seems quite appealing. It’s the key variable in my Musical chairs formula. See my update above.
2. January 2016 at 13:26
Scott, you don’t care about inflation but I think you want asset inflation. You would not be adverse to 150 dollar oil, if I understand that view correctly. Well, turns out that according to BAC, the Fed has been mispricing risk. So, if by mispricing risk, assets rise, (and sometimes fall), doesn’t the Fed practice at least one part of NGDP in a hidden way, in a criminal fashion? I always thought risk on MBSs were mispriced. Now I know that was a bubble blowing NGDP! Right? And it was a crime against Americans, IMO.
2. January 2016 at 14:31
Gary, You said:
“Scott, you don’t care about inflation but I think you want asset inflation.”
Why would I care what you think? Please just go away, before you make a complete fool of yourself.
2. January 2016 at 14:42
Scott,
Did you see this?
http://rogerfarmerblog.blogspot.lt/2015/12/scott-sumner-and-musical-chairs.html
2. January 2016 at 16:35
Egads, why is the entire economics profession, as well as the central banking profession, obsessed with minute rates of inflation?
At the 2915 Jackson Hole confab of central bankers, there were six panels; all six where on inflation. This in a world of weak demand, and extraodinarily low inflation and even deflation.
BTW, the Bank of Thailand has a 2.5% IT, + or – 1.5%, or an inflation band of 1% to 4%.
The U.S. economics-central banking community has become so hidebound that even a change to an inflation band is not on the discussion table.
As Sumner alludes, how to measure housing costs? Expecially in a nation in which housing has a noose around supply, in the form of local zoning codes?
2. January 2016 at 17:38
Sumner’s graphical update: “If nominal wages are very sticky (and they are) then NGDP shocks largely explain variations in the unemployment rate” – no they don’t.
Does Sumner realize that the correlation between the employment cost index and unemployment is simply an accounting identity? It is not necessarily ’cause and effect’, and saying it is does not make it so. Simply put: employment cost goes down when there are fewer employees on the payroll. This does not ‘prove’ unemployment can be prevented by attempting to inflate NGDP. It’s ludicrous to suggest otherwise.
2. January 2016 at 17:41
Nick and Scott,
The question is: are hedonic or absolute prices sticky?
If hedonic prices are sticky, which seems to be really strange to me, then they are what matters. But, if absolute/list prices are sticky (e.g. the price of a computer is stuck at $1000, even though a new version with newer software and improved hardware is released), then hedonic prices are irrelevant for monetary policy; the central bank only need care about stabilizing the sticky absolute prices, even if it means that hedonic prices are falling.
For a more detailed (and trustworthy) explanation see section 10 (I think) of http://www.columbia.edu/~mu2166/Handbook/paper.pdf (slides: http://www.columbia.edu/~mu2166/Handbook/slides.pdf)
Regarding the musical chairs model, the fact that the Nominal Wage/NGDP ratio (equivalent to Real Wage/RGDP ratio) tracks unemployment only means that the labor demand curve is a negative function of the labor supply. In a completely frictionless neoclassical model, the real wage equals the marginal productivity of labor, which assuming the production function Y = F(K,L) = K^a L^1-a, is w = (1-a)(K/L)^a -> w = (1-a)(Y/L). Dividing by Y (to get the NGDP/Nominal Wage ratio) yields w/Y = (1-a)/L. Assuming the population is unit mass and all non-employed agents are engaged in search for a new job (i.e. unemployment as measure by the BLS), this can be rewritten as
w/Y = (1-a)/(1-u)
linearizing gives
ln(w/Y) = ln(1-a) + u
In words, that graph doesn’t prove nominal wage rigidity, it validates neoclassical theory in which nominal wages are not sticky at all. To be clear, I’m not suggesting that nominal wages aren’t sticky, I’m simply saying that the chart doesn’t prove that that is the case.
2. January 2016 at 18:02
Vaidas, Yes, It’s a good article. I left a comment.
John, I tend to agree that prices are less likely to be sticky if measured using hedonics. Of course that’s the way price indices are actually measured, suggesting that CPI inflation is not the right variable. But I’m more interested in how to measure housing prices.
You said:
“In words, that graph doesn’t prove nominal wage rigidity”
Yes, that’s obvious.
You said:
“Regarding the musical chairs model, the fact that the Nominal Wage/NGDP ratio (equivalent to Real Wage/RGDP ratio) tracks unemployment only means that the labor demand curve is a negative function of the labor supply.”
I’m not sure what that means.
2. January 2016 at 19:45
Scott,
What I meant by that is: W_t/P_t is decreasing in labor demand. A high real wage is consistent with low labor demand — and vice versa.
2. January 2016 at 19:50
No Scott, you emailed me a long time ago and you said you didn’t see anything wrong with 120 dollar oil. I remember crap like that. So how do you think the consumer would survive with 120 dollar oil now? You think that would help the consumer?
Maybe you changed your view. Or maybe you are just not a nice guy.
2. January 2016 at 19:56
I don’t care if you care what I thin. I never have. I care what YOU think and I think you are a dangerous thinker. If you prove me wrong I will be happy, but really, 120 oil? Seriously, Scott?
2. January 2016 at 20:00
John, You said:
“What I meant by that is: W_t/P_t is decreasing in labor demand. A high real wage is consistent with low labor demand — and vice versa.”
Yes, demand curves slope downward. Or are you saying something else?
Gary, Maybe you don’t know how to read. Saying I don’t have a problem with something is not the same as saying I want something. I actually don’t think my opinion or your opinion as to what oil should cost are of any importance, that’s for the market to determine.
2. January 2016 at 20:02
Sorry, “think”.
2. January 2016 at 20:13
Scott,
Yes, that’s it exactly. Your chart serves only to prove that neoclassical theory is right about that; the labor demand curve slopes downward. That chart would look the same if there were no nominal rigidity of any kind, if only prices were sticky, if only wages were sticky, or if both prices and wages were sticky.
2. January 2016 at 20:27
The musical chairs model is better used as a description of the Federal Reserve System. No matter how bad the outcomes, the only solution is to replace one chair with another. Never bankruptcy and closing of its doors.
2. January 2016 at 20:53
Thank you for that answer, Scott, so I will try to understand your views as I go on. But just one thing: if the oil futures market is cornered then it isn’t a market. Now we read that the price of oil could be low for too long, causing less production and a massive unpleasant snap back. It seems like, in the oil market, there is only risk on and risk off. The free market means squat.
3. January 2016 at 05:17
John Handley schooling Sumner: priceless. And from the paper Handley cited, it supports the idea that money is neutral (see blurb below). If deflation is present, it shows, as per the below, money is neutral. Put another way: if money was not neutral, why has all the “QE”s of central banks not worked? Duh.
Pg. 44 of the paper: “We have established thus far that in an economy in which the only nominal friction is a demand for fiat money, deflation at the real rate of interest (the Friedman rule) is optimal. We have also shown that when the only nominal friction is the presence of nominal-price- adjustment costs, zero inflation emerges as the Ramsey optimal monetary policy. A realistic economic model, however, should incorporate both a money demand and price stickiness. “[Note: that zero inflation,as we have now, flows from the model given money neutrality, but the authors artificially incorporate price stickiness and money demand function, which may not exist in real life]
3. January 2016 at 06:02
Off topic again: this article on Jane Jacobs and city economics makes many excellent points. But I would particularly like to hear Scott’s take on the monetary question: how many currencies should the world have?
http://www.zompist.com/jacobs.html
3. January 2016 at 10:05
John, The chart has nothing to say about real wages, nothing at all.
The purpose of the chart is to show what happens when W/NGDP changes. That’s all. It says nothing about causation.
Gary, You said:
“Now we read”
No, you read nonsense written by idiots, I do not. (Unless reading some of my commenters.)
Ray, You don’t even know what monetary neutrality means, so how can you possibly know if it applies to QE?
Saturos, About 150.
3. January 2016 at 10:08
Saturos, Wow, that article is awful. Stagflation is not supposed to be possible under monetarist theory? Why does he think monetarism became so popular in the late 1970s?
3. January 2016 at 10:21
Scott,
“The chart has nothing to say about real wages, nothing at all.”
I know that. Please pay attention to what I’m actually saying.
Suppose there is a representative firm that uses capital and labor to produce output with the technology Y = K^a L^1-a. The firm maximizes profit, P = Y – wL – rK.
The FOC for the real wage is w = (1-a)(Y/L)
dividing by Y yields the nominal wage to NGDP ratio:
w/Y = (1-a)/L
From this, it is clear that the nominal wage to NGDP ratio should roughly follow unemployment. That is; your chart serves as vindication of RBC models, not of the musical chairs model. So, again, “[t]hat chart would look the same if there were no nominal rigidity of any kind, if only prices were sticky, if only wages were sticky, or if both prices and wages were sticky.”
3. January 2016 at 10:27
Ray,
The paper I linked goes on to add sticky prices to the model. At that point, money is no longer neutral and the optimal monetary policy is not the Friedman rule; it’s inflation somewhere between negative the rate of time preference and zero. The authors of the paper clearly don’t think that money is neutral; they are simply systematically going about determining the optimal rate of inflation given certain assumptions.
3. January 2016 at 12:01
In a perfect world, inflation should use points of indifference. In some thread awhile back, Scott said the productivity of computers wasn’t accurate because price differences didn’t reflect quality differences. I didn’t understand it. Micro 101 with trading off guns and butter still makes the most sense to me.
I don’t know about NK models, but inflation is useful for two different things:
1. Tracking living standards.
2. More subtly, creating predictability for real interest rates. VARYING inflation, rather than high or low inflation per se, creates real economic loss through all the hedging lenders do to counter the risk of higher rates. Fixed-rate loans were standard from the 50’s through mid-70’s. Banks and insurance companies kept all interest rate risk on their books. With a stable inflation or NGDP rate, the financial sector would not see the need for all this real deadweight involved in hedges.
NGDP is better for cyclical unemployment and it’s far easier to measure. But I can see the reasons for an inflation level rather than NGDP level target.
On another note, I did see the Big Short and read the book when it came out. The movie didn’t connect dots from housing crisis to unemployment. Those dots are only connected with the banking crisis pushing natural rates below zero. Because the Fed would not take what it calls “extraordinary measures,” money became an asset rather than a unit of account.
What’s sad is Michael Burry, among many other value investors like Seth Klarman, rail against “easy money” Major Freedom style. This is not VSP style wishful-thinking. They honestly can’t see how low interest rates and QE aren’t just like the pool of liquidity buying mortgages. The fact the new money buys only safe assets falls on deaf ears. No matter how long inflation doesn’t rise or “the next bubble” doesn’t happen, the view remains. I don’t know how to break through it.
3. January 2016 at 13:59
Lol, Scott, that was funny and I had to laugh. But this is what happens in the real world:
DEFINITION of ‘Risk-On Risk-Off’
An investment setting in which price behavior responds to, and is driven by, changes in investor risk tolerance.
Read more: Risk-On Risk-Off Definition | Investopedia http://www.investopedia.com/terms/r/risk-on-risk-off.asp#ixzz3wDiQ7D47
Follow us: Investopedia on Facebook
So, Scott, that is exactly what has been the trade in commodities and stocks at least since investment banks were allowed to take large positions in commodity trades in the ’90’s. Risk tolerance is also determined by the Fed as it misprices risk according to BAC. That happened in the Great Depression as well, which is why Will Rogers said:
“We never will have any prosperity that is free from speculation till we pass a law that every time a broker or person sells something, he has got to have it sitting there in a bucket, or a bag, or a jug, or a cage, or a rat trap, or something, depending on what it is he is selling. We are continually buying something that we never get from a man that never had it.” DT #1301, Sept. 24, 1930
3. January 2016 at 15:14
It is possible to use NGDP targeting in a partially dollarized country such as Argentina? or because of it the central bank has less “power” to target nominal income?
3. January 2016 at 16:41
Although, Scott, you could say that with long bonds, the trade has often been risk on risk off at the same time, as the stock market and bond market went up together.
3. January 2016 at 17:49
@John Handley: yes, I know that. I love your back and forth with Sumner, who is game enough to reply (most famous economists would not; imagine Krugman or Summers, who is a blowhard, doing so; they prescribe to the Oriental Despot theory of gravitas). But your chances of persuading Sumner of your views are very small, as he is hard to pin down. Years of bunker mentality have hardened him. All the more surprising then that NGDPLT is being promoted by various parties (including Krugman); they’ve drunk the Kool-Aid despite little evidence there is nominal rigidity in any modern economy. Perhaps back in the 1950s when labor union membership peaked (at roughly 33% of the workforce in the USA in 1945) but not now (at 11%)* Note further that there was little ‘stickiness’ in 1933 (see below**), further proving that the Great Depression was not really about nominal rigidities at all, but more likely simply a random depression that lasted longer, possible due to irrational factors or changes in technology (switch from farm to city; steam power to electrical; horse to car, etc).
RL
* internet screen scrape: “In 2013, the percentage of workers belonging to a union in the United States (or total labor union “density”) was 11.3%, compared to 20.1% in 1983.[1] From a global perspective, the density in 2010 was 11.4% in the U.S., 18.4% in Germany, 27.5% in Canada, and 70% in Finland.[2] **Union membership in the private sector has fallen under 7%[3] — levels not seen since 1932″
4. January 2016 at 03:45
“Derivs, I never blamed the Fed for the debacle of 2007-08, I blamed them for the recession of 2008-09. The distinction is crucial.”
Fair enough.
In the clips for the film they seem to believe there was a big housing bubble, which would inevitably burst. “Actually they believed underwriting standards were 0, mortgages were being securitized and sold at incorrect prices, and that the whole thing would fall apart, they actually all missed the credit counterparty contagion it would cause.”
Do they explain why the British, Canadian, Australian and New Zealand bubbles (all quite similar) never burst?” Good question, I have a preliminary opinion but not well developed or one I can concretely tie to. Leave it to say I don’t remember having panic attacks about my exposure to NAB or ANZ.
…and you should see the movie simply because it was entertaining, hilarious, and the acting was excellent.
“Now we read that the price of oil could be low for too long, causing less production and a massive unpleasant snap back.”
Gary, that is what markets do. Always have and always will. For those that refuse to listen to her, she must cause them extreme pain. Even if it has to go to $1. Little known fact:The market, like Buddah, is cognizant of all around it, but more like Shiva, she LOVES dishing out destruction and pain to those that dare to challenge her.
“No Scott, you emailed me a long time ago and you said you didn’t see anything wrong with 120 dollar oil. ”
Me either… 120 oil.. only a matter of time…
“hating on the financial sector in the US may seem like fun,”
Jean, wrong person to be saying that to. I only hate Goldman… oh how i wanted to see them get shut down…
4. January 2016 at 12:27
John, Yes, I’ve discussed exactly that point in previous posts. You need both the statistical relationship and the assumption of sticky wages to get the musical chairs model. The statistical relationship alone is not enough.
Matt, To measure living standards you need to measure inflation. But how do you measure inflation? Polls show that Americans are no happier than in previous decades, does that mean RGDP/person has not grown? Is it all inflation? What are “living standards”? Utility? Number of toys?
I don’t understand your comment about real interest rates—why is that useful?
Martin, Yes, they can use it, dollarization doesn’t matter unless it’s total.
4. January 2016 at 12:29
John, Please read this post:
http://www.themoneyillusion.com/?p=31217
4. January 2016 at 16:38
Don’t know if I’m responding too late. On interest rates, the lender and borrower have an expectation of future inflation. If inflation is expected to be 10%, lenders won’t lend at 2%. Nor will borrowers borrow at 2% when inflation is 10%.
If the actual inflation rate differs from the expected rate, there’s a transfer from lender to borrower or borrower to lender. That transfer wasn’t what was expected.
Under NGDP targeting, inflation could fluctuate more than inflation targeting. So you may have real losses from overhead for hedging.
4. January 2016 at 17:04
“Nor will borrowers borrow at 2% when inflation is 10%.”
I would.
6. January 2016 at 09:23
Matt, Suppose inflation was zero and RGDP growth was 20% per year. How would you feel about lending money at 5% for 30 years?
You lend an hour’s worth of your output, and get back 5 minutes worth of your output. Yes, it’s worth more in “real” terms, but is it really worth doing?
In other words, it’s not so much interest rates minus inflation that matters, it’s interest rates minus NGDP growth.
6. January 2016 at 11:55
“it’s not so much interest rates minus inflation that matters, it’s interest rates minus NGDP growth.”
WHAT?????????????… are you saying that if he were in Brazil right now, with negative NGDP growth, he should be happy to lend at flat to negative even with 10%+ inflation? That’s nuts!!!!
“Suppose inflation was zero and RGDP growth was 20% per year. How would you feel about lending money at 5% for 30 years?”
Scott, you are asking a question that is missing waaaaayyyy too much information for anyone to properly answer.
What does the entire yld curve look like? Where are all the forward curves in commodities? Are they flat, backwardated, contango? How could they be flat at 5% (suggests contango) and how could they not be flat if there is no inflation (suggests flat)… Also getting long the economy leaves you short the put on that economy and at 20% you are implying a pretty high vol. What do you think that put will cost you to take off and make your play risk free as well????
..you are essentially implying that no one should lend Google/Alphabet a billion+ @ 3.375 since their 5yr ROE is over 20%. only an idiot wouldn’t buy the stock!! But the market gladly did fill them @3.375… Let’s see what an at the money google put costs … $82 vs $740 or 11% of the underlying…ouch!!
and if Matt said he was eyeing that Enzo for 3mil. and a year later bought it for 3 mil and had 150k in cash for lap dances, did it all **risk free**… in my book, nothing at all to be embarrassed about.. I’d even congratulate him as he was driving us all to the club to blow the extra 150k…
6. January 2016 at 20:42
Scott, that’s literally the only bit I disagreed with, and the bit about tariffs. Why don’t you buy the argument about subnational currencies? Surely you agree that it often makes more sense to analyze an economy in terms of its component regions.
7. January 2016 at 12:42
Derivs. I have a new post on this, let’s bring the discussion over there.
Saturos, It’s possible that subnational currencies make sense, but I don’t see much evidence. Where you have them (as in China, which has 3) each currency has a separate fiscal authority. Might there be a need for different currencies under the same fiscal authority? Perhaps, but I haven’t seen the evidence. Do you have any evidence?