

Happy talk on the economy
In 2016, conservative commentators told us that Trump was doing well because the economy was performing so poorly, especially for average Americans. Trump said the same thing, using terms like “American carnage” in his inaugural address. Now we are told that the economy is doing well. Here’s Jim Geraghty of the National Review:
If the economy is still humming like this in November, and incumbent Republicans perform badly in the midterms, it will blow up the conventional political wisdom of, “it’s the economy, stupid.” Those of us who are not fans of the daily drama and perpetual controversies of this White House will have evidence to support the argument that Trump’s tweets and tirades are not just silly distractions; they’re enough to counteract what would be a key political strength for most administrations.
And of course Trump engaged in his usual hyperbole in his recent State of the Union.
I’m going to try to bend over backwards to be fair to both sides. I think you can make a reasonable argument for each of the assertions made above, for 2016 and 2017. What you cannot do is simultaneously claim that both assertions are true. After all, jobs were the key issue that people used in 2016, when describing the plight of average Americans. And job growth in 2017 actually reached the lowest levels in years (the graph shows year over year percentage change in payroll employment):
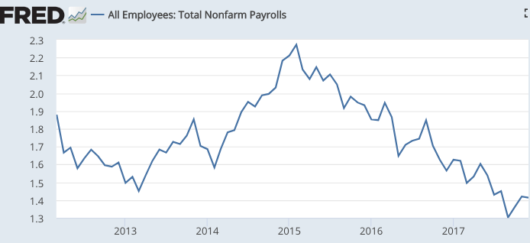 That’s not a bad performance, just no sign that the jobs crisis we were told about in 2016 has been solved. Remember when Trump said the “true” unemployment rate was anywhere from 20% to 40%? His supporters can’t now claim that job growth slowed in 2017 because we are running out of workers.
Inevitably, some commenters will misread this post. They’ll accuse me of saying the economy is not doing very well, even though I never said the economy is not doing very well.
Or they’ll cherry pick other indicators. Some, such as stock prices, are of no relevance to this post. Stocks did extremely well under Obama, and obviously were not a part of the economic “carnage” that Trump referred to in January of last year. Some will point to other indicators. But for every indicator that’s gotten modestly better in 2017 (RGDP) you can find another that’s gotten modestly worse (from a Trumpian perspective):
That means that the final 2017 U.S. deficit with China/HKG may be up 17%-18% from the $280 billion consolidated China/HKG deficit recorded for 2016.
If you believe the Autor, Dorn and Hanson study of the impact of China trade, (or perhaps I should say how it’s been interpreted, their claims are more nuanced); this is really bad news for the US economy, and especially for the blue collar Trump voters. As Forbes correctly notes, however, our ballooning trade deficit with China is actually good news for the US economy (and, I would add, even for Trump voters.) Another way of putting it is that the entire Trump campaign was built on misinformation, and that’s really, really good news. (And I’m not going to exempt the conservative intellectual establishment (especially non-economist intellectuals), which to some extent bought into the claims that trade was hurting average Americans.) So which is it? Is the trade deficit with China a big problem? Or is the economy doing better? Trump would say both, but you can’t have it both ways.
I think people need to stand back and look at things objectively, the view from 30,000 feet. When you do so you see an economy that is gradually growing, a bit better than in 2016 (in my view due to better public policies), but not dramatically different from what was occurring during recent years.
Why does this matter? After all, everyone entitled to describe the economy any way they wish. The problem occurs when you start to make inferences about things like the midterm elections. Notice that Geraghty suggests that if the economy is the deciding issue, the GOP should do well in 2018. But if that were the case then the Democrats should have done well in 2016. His post is written as if the stuff that Trump says, or that gets reported on Fox News, is actually true. But it’s not true. The economy is not that much different from a year ago.
PS. The problem of bias reminds me of a wonderful Eliezer Yudkowsky post of fairness:
The notion that you can “be fair to one side but not the other”, that what’s called “fairness” is a kind of favor you do for people you like, says that even the *instinctive* sense people had of law-as-game-theory is being lost in the modern memetic collapse. People are being exposed to so many social-media-viral depictions of the Other Side defecting, and viewpoints exclusively from Our Side without any leavening of any other viewpoint that might ask for a game-theoretic compromise, that they’re losing the ability to appreciate the kind of anecdotes they used to tell in ancient China.
Unfortunately, the post is hard to excerpt–you really need to read the whole thing.
PPS. Hypermind is currently forecasting 4.6% NGDP growth from 2017:Q1 to 2018:Q1. If my math is correct, that implies about a 4% annualized growth rate in the first quarter of 2018. The implied RGDP forecast is probably about 2%, or a bit higher. The Blue Chip consensus has first quarter RGDP growth coming in around 2.6%. But the Atlanta Fed is forecasting 5.4% RGDP growth in Q1. It will be an interesting quarter to watch.
HT: Craig Fratrik
Tags:
2. February 2018 at 22:52
What keeps you up at night?
Let’s pretend.
Let’s pretend for a moment that it’s December 24th 1913 and we’re maritime detectives.
We wake up on this cold December morning to read the newspaper and find that the government has just established the Federal Reserve. The Fed is a new central banking system that has been created after a series of financial panics led to the desire for the control of the monetary system in order to alleviate financial crises. In the future, if the stock market or dollar value looks bad, the Federal Reserve can step in and protect the people and their money.
The creation of The Fed comes after multiple failed attempts to do so in the past, but this time the major opponents of a government operated bank were unable to present their cases. The three men who had opposed and successfully stopped the pervious attempts to create a federal banking system were all dead. They had all died together and they all died on a boat that sunk a year before.
We’ll, as maritime detectives we just can’t help ourselves. This is a mystery! We can get to the bottom of this. A terrible murder has taken place on an ocean liner and we must discover the truth. There are multiple victims and a lot of facts to sift through but we’ll do our best.
Let’s start with the oceanic equivalent of a 911 call and examine the signal flare that was meant to alert authorities that something was amiss. Upon inspection we find that the traditional RED flares meant to signal distress have been replaced by WHITE flares, the kind that signify no problems are present and any passerby’s should carry on.
Let’s examine the radio equipment and the logs kept of the transmissions. The equipment has been lost in the incident and all known communications with the distressed vessel are incomplete or misunderstood by nearby vessels.
Let’s look at the owner of the ship, JP Morgan, and find that he was not on board at the time of the criminal activity. However, a handful of the world’s financial elite, including three men who opposed central banking, were his guests on the ship and died in the ensuing incident.
Let’s look at the captain. With a spotless record and a mind for safety, why would he put the most famous ocean liner ever built in danger for the sake of an inconsequential arrival deadline?
[The Captain of the Titanic made it off the ship alive in real life. Now why would Hollywood present the event as having the Captain going down with the ship and dying? Who controls HW? Who really controls HW?]
Let’s look at the ship. Why was its unsinkable design horribly flawed? It allowed for the perception of safety, but not actually keep anyone safe. Why was the ship dangerously undersupplied with life rafts? Why were magnetically sealed doors used to keep third class passengers below deck?
Let’s examine the murder weapon. A large iceberg that slammed into the ship as it churned through an Atlantic Ocean ice field in the middle of the night. Was the iceberg the only object that struck the ship?
Now as maritime detectives, we’re stumped. There are too many loose ends and not enough answers. The three men whose deaths we’re investigating are counted among the 1300 people who died and have become a statistic. John Astor, Benjamin Guggenheim, and Isa Strauss all perished onboard the Titanic, leaving the next attempt to create The Federal Reserve unopposed.
Sitting in our study we look at the facts before us. The morning has turned into late afternoon and we’re stuck looking at leads and dead ends. It’s Christmas Eve and we’re with our families, smiling and eating and having fun. But our mind cannot tear itself away from the feeling that something is wrong. We have a restless night and wake up having slept little and no closer to answers.
But it’s Christmas Day, and our lives are waiting. We put the mystery aside and join our families in celebration of life.
Now let’s not pretend. It’s you and me now. Us. This story is based upon truths. There are many lingering questions surrounding the sinking of the Titanic and some are as simple as ‘Why were the emergency signal flares white and not red?’ Some are more complex like ‘Why was the unsinkable design so horribly flawed?’ And others just don’t have any answers. The questions like, “Did JP Morgan intentionally sink the Titanic, killing Astor, Guggenheim, and Strauss and allowing for the creation of the Federal Banking system?” have no real answer.
Or do they?
Hindsight is 20/20 and as humans, we are in no better a position to look back upon our history and question it than we are now. We can question not just the acts themselves, but the intent behind them. Who benefitted, and why? The timeline is long enough that we can see the paths of businesses and people and track their every move and how they’ve gained control. Control of our banks and control of our governments. Control of our lives.
What follows is an attempt by We, the People, to regain control of our lives, our governments, our banks. We are not at their mercy.
2. February 2018 at 22:54
How did Soros replace family ‘y’?
Who is family ‘y’?
Trace the bloodlines of these (3) families.
What happened during WWII?
Was Hitler a puppet?
Who was his handler?
What was the purpose?
What was the real purpose of the war?
What age was GS?
What is the Soros family history?
What has occurred since the fall of N Germany?
Who is A. Merkel?
What is A. Merkel’s family history?
Follow the bloodline.
Who died on the Titanic?
What year did the Titanic sink?
Why is this relevant?
What ‘exactly’ happened to the Titanic?
What ‘class of people’ were guaranteed a lifeboat?
Why did select ‘individuals’ not make it into the lifeboats?
Why is this relevant?
How do we know who was on the lifeboats (Dead or Alive)?
How were names and bodies recorded back then?
When were tickets purchased for her maiden voyage?
Who was ‘specifically’ invited?
Less than 10.
What is the FED?
What does the FED control?
Who controls the FED?
Who approved the formation of the FED?
Why did H-wood glorify Titanic as a tragic love story?
Who lived in the movie (what man)?
Why is this relevant?
Opposite is true.
What is brainwashing?
What is a PSYOP?
What happened to the Hindenburg?
What really happened to the Hindenburg?
Who died during the ‘accident’?
Why is this relevant?
What are sheep?
Who controls the narrative?
The truth would put 99% of people in the hospital.
It must be controlled.
2. February 2018 at 22:58
Wealth (over generations) buys power.
Power (over generations) buys more wealth/control.
More wealth/control buys countries and its people.
Families combined (TRI) = NWO.
Inner TRI families will collapse.
What is the keystone?
What Nation dominates all others?
What Nation has influence over most others?
What is the keystone?
Return to Saudi Arabia
Strings cut (+++).
Puppets (+++) in shadows.
Each side of the triangle controls a certain subsect of power brokers.
Power brokers are also labeled as the puppets/servants.
What is the New World Order?
Why did POTUS receive a sword dance when visiting Saudi Arabia?
What does this mean culturally?
Why is this relevant?
What occurred in Saudi Arabia?
How did POTUS remove one side of the pyramid?
What did POTUS receive while visiting China?
Where did POTUS dine?
What is the significance?
What if China, Russia, and others are coordinating w/ POTUS to eliminate the NWO?
Who controls North Korea
Who really controls North Korea?
Who controls several agencies within the US, EU, and abroad?
Why is NSA so vital?
Enormous scale of events currently ongoing.
Why is Russia helping to kill ISIS?
This is not easy to accept nor believe.
Crumbs make bread.
Operations active.
Joint missions underway.
The world is fighting back.
The Great Awakening.
2. February 2018 at 22:59
Hard to swallow.
Important to progress.
Who are the puppet masters?
House of Saud (6+++) – $4 Trillion+
Rothschild (6++) – $2 Trillion+
Soros (6+) – $1 Trillion+
Focus on above (3).
Public wealth disclosures – False.
Many governments of the world feed the ‘Eye’.
Think slush funds (feeder).
Think war (feeder).
Think environmental pacts (feeder).
Triangle has (3) sides.
Eye of Providence.
Follow the bloodlines.
What is the keystone?
Does Satan exist?
Does the ‘thought’ of Satan exist?
Who worships Satan?
What is a cult?
Epstein island.
What is a temple?
What occurs in a temple?
Worship?
Why is the temple on top of a mountain?
How many levels might exist below?
What is the significance of the colors, design and symbol above the dome?
Why is this relevant?
Who are the puppet masters?
Have the puppet masters traveled to this island?
When? How often? Why?
“Vladimir Putin: The New World Order Worships Satan”
3. February 2018 at 06:53
Wow. And I thought Major Freedom was nuts.
3. February 2018 at 07:06
Related observation. Obama won in 2012 with a worse economy than in 2016. I don’t recall Romney making as much of an issue of the economy as Trump did? I think Dems have a hard time saying “the economy is great”. Or even “good”. I think they feel like it’s saying to anyone who is out of work, “it’s your fault”. So instead they talked about “Fight for $15” and things like that.
3. February 2018 at 07:20
Q Anon, Good questions!
3. February 2018 at 12:35
“Notice that Geraghty suggests that if the economy is the deciding issue, the GOP should do well in 2018. But if that were the case then the Democrats should have done well in 2016. His post is written as if the stuff that Trump says, or that gets reported on Fox News, is actually true.”
None of the statements in this paragraph are necessarily true, and some are false.
Republicans controlled congress for the latter years of Obama’s presidency and (relatedly) he had no major economic legislation during this period to which he could point to. So no, Democrats can not be expected to get credit (or blame) for the economy in 2016 in the same way Republicans did in 2006 and 2008, or Democrats did in 2010. It’s also dubious at best that Trump’s victory had much to do with the economy; his victory was mainly because he was running against a Democratic successor to a 2 term Democrat incumbent. Almost any Republican would win that. The fact that he lost the popular vote, if anything, reflects that he wasn’t a very good candidate. I maintain, however, that there’s not much to explain in him winning. It was perfectly concordant with political trends.
Lastly, you’re underselling economic performance (perhaps reflecting your biases). I noticed wages are nowhere mentioned in your post. Wages saw their largest gain in 8.5 years, according to Reuters. And unemployment continued to go down approaching it’s low point for the century thus far. Sure, Trump pooh poohed the unemployment rate as the right metric, as everyone does in the never ending, flip flopping war of the unemployment metrics, but that doesn’t make the metric irrelevant, certainly not irrelevant to public perception. And lastly, Trump =/= congressional Republicans. They are (correctly) perceived by everyone except hardcore Democrats as distinct and often conflicting entities, and for congressional Republicans, local politics matters more than for Trump, so their destinies are not thoroughly intertwined.
I think it’s likely the case that the Democrats this year are in the weakest position of an opposition party midterm challenger since the 1990s. The last time they swept congress, they had an economic crisis, a couple of serious wars, and rising healthcare costs to campaign against. They have neither crisis nor war now, and they can’t pin the healthcare status quo fully on the GOP like they could in 2006. Republicans have been sufficiently willing to compromise on immigration to assuage the majority of the public on that matter. Democrats don’t have many big issues other than the president’s twitter account to carry them across the finish line. So they’ve focused on identity politics instead, which is great for rallying the hardcore base, but likely backfires with everyone else. I think their chances for the House are probably around 50/50.
3. February 2018 at 13:16
Jeff made me LOL. Thanks @Jeff!
@Mark, “Democrats don’t have many big issues other than the president’s twitter account to carry them across the finish line. So they’ve focused on identity politics instead”
That’s true of many Dems, especially on the twitter, but the Democrat campaigns have been learning over the past 12 months. In WI SD #10, one of the top bullet points from winning the race was “No mention of Trump”.
I do agree with you about the effect of rising wages on these mid-term elections though.
3. February 2018 at 15:19
Mark, You said,
“It’s also dubious at best that Trump’s victory had much to do with the economy; his victory was mainly because he was running against a Democratic successor to a 2 term Democrat incumbent.”
I think you missed my point. It was others who claimed that Trump won because ordinary Americans were struggling. That was not my view.
As far as the mid-terms, let me remind you that Trump is one of the least popular American presidents in history. Surely that factor will play a role.
As far as wages, real wages did very well during the last couple years of Obama.
3. February 2018 at 19:27
Scott,
Leaving politics aside, some questions…
What is a sustainable RGDP growth rate?
How do you explain the drop in LFPR. Will it recover?
Ditto for the shift to part time employment?
Why was the most recent recovery so slow and why aren’t we back to trend?
I don’t think you can really assess how well the economy is doing until you answer those questions.
3. February 2018 at 20:57
dtoh,
Professor Sumner can surely answer these far better than I can, but here are some thoughts to get you started (and some good references). Answering this is also just way too fun for me to pass up.
1. Trend RGDP growth probably lies in a 90% confidence interval from 1.5 to 1.8 percent. I believe Sumner is far more pessimistic than I am on this, and thinks trend RGDP growth is closer to 1 percent. (The Fed has been consistently far too optimistic on this, and the median policymaker is now projecting sub-2 percent as a new trend.) The deregulation adds some upside risk to these, and potentially the tax cuts, though I’m far more pessimistic on that due to the dampening effects of higher deficits.
2. This study from the Board of Governors is perhaps the most cited on the subject:
https://www.federalreserve.gov/pubs/feds/2014/201464/201464pap.pdf
Here’s another recent one by Alan Krueger: https://www.brookings.edu/wp-content/uploads/2017/09/1_krueger.pdf
The bulk of the fall seems to be factors such as demography (baby boomers turned 62, I believe, in 2008, for example), a rise in the education premium, and possibly hysteresis–Sumner definitely disagrees with me on this last point. It most likely won’t recover. Here’s a good excerpt from Krueger’s paper:
“Given the pre-existing downward trend in participation for most demographic groups and the aging of the U.S. population, stabilization in the labor force participation rate for a time may represent the best one could expect for a cyclical recovery. If a cyclical recovery in labor force participation is unlikely, then a reversal of secular trends toward declining labor force is the only way to achieve an increase in labor force participation.”
There’s another excellent paper by Krueger (see below) on the disconnectedness of the long-term unemployed and the job market, which plays into the hysteresis story. (It also made for quite a funny presentation he went year by year showing predictions from economists that the LFPR would rise… only for it to stay precisely where it was.)
https://www.brookings.edu/wp-content/uploads/2017/09/1_krueger.pdf
There are some interesting Phillips-curve implications there as well, by the way, but that’s a fairly hotly debate subject in the literature.
3. I’m less familiar with the literature on this subject, but there are plausible arguments that much of this is due to changes in the composition of the labor market in favor of sectors that demand more part-time work. At the very least, it no longer appears to be of a cyclical nature. Here’s one good reference on this:
https://www.federalreserve.gov/econresdata/notes/feds-notes/2014/why-is-involuntary-part-time-work-elevated-20140414.html
4. I think Sumner would argue, as would I, that we are ‘back to trend.’ The problem is, we’re back to a trend that is lower than historical standards. I think there are a lot of reasons for this. First, here’s the one Sumner won’t agree with me on: the Rogoff-Reinhart effect (see below).
http://www.nber.org/papers/w14656.pdf
Ironically, by their estimates, I think we’re above average in terms of speed of recovery from a financial crisis. Their argument essentially is that the persistent effects of financial crises in the form of a large build-up in household debt necessitates a protracted, subsequent period of deleveraging. It doesn’t exactly help that homes are such a large portion of the average consumer’s balance-sheet and wealth effects are rather large.
The second argument is along the lines that someone like Bernanke would argue. Headwinds–fiscal contraction (I can imagine Sumner rolling his eyes), subdued global growth, global savings gluts pushing down r*, deleveraging, etc.–hampered the transmission of monetary policy to AD, so growth remained slow. notwithstanding the Fed’s ‘extraordinary measures.’ The counter to this might be the Larry Summers types who assert that these structural forces are far more permanent, though the recovery to date, the apparent rebound, though slow, in r*, and the Fed’s rather seamless tightening as late challenges this. (Larry thinks it’s very difficult, if not impossible, for financial stability and stable growth to coexist.)
Finally, you get Sumner’s argument: “It’s the monetary policy, stupid!” Monetary policy was arguably far, far too tight, particularly in 2008, and the Fed was unwilling to do ‘whatever it takes’ to restore growth, and thus in a large sense willed the slow recovery into existence — in part because they confused low rates with easy money.
Well, that’ll do!
3. February 2018 at 20:58
Oops, I pasted the wrong Krueger link. Here’s his second paper on LT unemployment: https://www.brookings.edu/wp-content/uploads/2016/07/2014a_Krueger.pdf
3. February 2018 at 21:07
That’s strange–the original comment didn’t go through, but the correction to the comment did. Fascinating.
Anyway, I think this post is largely spot-on, and it’s very interesting to see how Trump’s most avid supporters will surely twist themselves into a pretzel to defend him at all costs. If the stock market was a metric before, I doubt you’ll be seeing any recent tweets about stocks now–or are stocks only ’caused’ by Trump when they’re on an upward swing?
3. February 2018 at 21:41
Basically, the President has been the biggest fake news developer of this century. Nonetheless, the power of the independent media to prove him a fool was significantly damaged in 2015 by the constant liberal MSM fake news shilling. When you consistently are proven wrong by the success of a complete fool of a candidate, the rational people in the country begin to question the credibility of both sides.
As a young man, I lost most of my faith in democracy (and the media) in 2016.
That’s regrettable, but I’ve now seen what our country can create. How can a “free” democracy elect someone who relies on lies and insane promises? How can a democracy allow the rigging of a primary in favor of the “elites'” candidate? The rest of the world should be watching in horror. Trump is not going to be the last radical president (or politician) in this century. He opened the door to many more.
As for wages, assuming all factors are the same, at 4.1% unemployment we should have 5% wage growth. At least, that’s what happened in late 2007-early 2008, the late 1990s, and the 1960s. Real wage growth should be 2-3% at this point of the cycle. It is .7%.
Either the error is a statistical issue or we are not looking at the right statistic (compensation growth is only 3.4%, real is 1.2%). Or maybe the principles we relied upon in 1978 are not as relevant in 2018? Who could’ve surmised?
Can people not see the world changing rapidly around them? Why do we still believe the past reflects the future? I learned thousands of principles, norms, and standards governing politics and economics at my university. Yet, in the space of a few years all of those were thrown out the window. What is their value if they fail in our time of most need?
People still haven’t realized how momentous the 2016 election was to our nation and the world. Faith in democracy? Tarnished. Our intel community? Crushed. Our media? Well, it was already gone. Basic statistics? Hahahaha.
Populists maintain power by discrediting the institutions that oppose them. Trump didn’t need to do much to finish the job.
4. February 2018 at 01:43
Nice blogging.
I didn’t know I was conservative, or a Trumpeter, but I think the effects of a large chronic current-account trade deficits are worth exploring. Exploding house prices and current account trade deficits are interesting. The “leprechaun” economy is interesting. Globalization of wages is a topic (and many nations appear to be caught in a middle income trap).
True and free trade presumes free transnational migration. But is that practical or desirable?
Must any neighborhood, culture or nation fall under the globalist hoof?
4. February 2018 at 07:40
Bernanke–a Bush nominee reappointed by Obama–chaired a Fed that nearly caused a depression, but that arguably did a lot better than his counterpart. His performance was especially better than his counterpart in 2011.
Bush made a good appointment and Obama was right to reappoint him. However, Obama left a few Fed seats empty for some time, which indicates that he probably did not appreciate how much this institution controlled job growth. Nonetheless, his two biggest calls, reappointing Bernanke and choosing Yellen, turned out being very wise.
Yellen was a very, very good appointment. She might be the best Fed chair in history. Sound monetary policy is the major factor explaining the good performance of the economy under Trump’s first year as President. He decided to replace her with a finance guy. The risk of a huge Fed blunder just increased significantly.
4. February 2018 at 07:42
Bernanke–a Bush nominee reappointed by Obama–chaired a Fed that nearly caused a depression, but that arguably did a lot better than his ***ECB*** counterpart. His performance was especially better than his ***ECB*** counterpart in 2011.
4. February 2018 at 10:20
dtoh, Here are some answers:
1. A few years ago I said 1.2%, now I’d say 1.5%.
2. The LFPR fell due to boomers retiring, more people on disability, and more young people choosing not to work (especially teens.) It may recover a little bit, but not all the way back up.
3. Not sure about part-time work. It may partly reflect government regulations (the problem is worse in Europe) and partly the preferences of workers.
4. The recovery was slow because of tight money and also a downward shift in the trend line. The latter factor explains why we’ll never get back to trend.
Fred, You said:
“First, here’s the one Sumner won’t agree with me on: the Rogoff-Reinhart effect (see below)”
I buy their argument for most financial crises, but not for those caused by tight money (like 1931-33, and 2008-09.) I believe other factors have recently reduced trend growth, even in countries lacking a financial crisis (say Australia).
(Comments with many links must first be approved by me, and hence are slow to go through.)
4. February 2018 at 11:01
@Fred
1) Sustainable RGDP growth rate – Don’t see how your numbers are anything other than a SWAG.
2) LFPR – Other than the portion of the drop caused by demographic reasons (which we all already know about), the Fed study is at best inconclusive in explaining the rest of the drop and by extension lacks any predictive value with respect to future changes in LFPR.
3) Shift to part time employment – Ditto.
4) Getting back to trend growth rate – Same comments as 1). I agree with Scott on the failure of monetary policy but think it was a much more massive failure because unlike Scott, I’m not inclined to drink the “secular stagnation” KoolAid.
Not claiming to have a crystal ball here, but it seems like we ought to stop making prognostications based on our political biases and instead admit that we don’t really know what’s going on with growth and employment and therefore are not yet in a position to judge how the economy is doing.
At a minimum it seems like a huge stretch to totally ignore RGDP growth and claim that the economy was no better in 2017 than 2016 solely on the basis of job growth numbers (and then have the chutzpah to accuse those with dissenting views of cherry picking numbers.)
4. February 2018 at 11:06
Hi Scott I wondered if you could comment on an idea I had about monetary policy.
I noticed that inflation excluding rent has been much lower than headline or core inflation. Now, in the long run rent depends on home and apartment construction. So while increasing interest rates dampens rent increases in the short run via lowering wage increases and such, it seems it could also make rents higher, after a lag, by making it harder to finance new buildings. For example, during the recession when as you say money was often tight, apartment construction fell precipitously. If building had remained on track we wouldn’t see such quick rent increases today. So, with regard to housing, it seems that tight monetary policy today can be evidence of tight monetary policy yesterday—in contrast to the general validity of Friedman’s point. Yesterday’s tight monetary policy is causing rent inflation to be higher today, which leads the Fed to pursue somewhat tighter monetary policy today. My understanding is that without rent inflation, core inflation would be more like 1% or lower for much of the last year.
Of course, that effect also applies in other industries: if the government raises interest rates, people invest lest in capital and this will make certain things less expensive. But to me what’s different is that housing is a very competitive market which counts a lot in the CPI: the more construction, the lower the CPI. When Apple takes advantage of low interest rates, by contrast, they probably won’t expand production to lower the price of iPhones; rather, they will invest in quality or research or come out with new products that might not make much of a dint in the CPI.
4. February 2018 at 11:08
correction: people invest *less* in capital and this will make certain things *more* expensive
4. February 2018 at 11:30
dtoh:
1. I don’t quite know what a ‘swag’ is. You can make the case that the interval I constructed was somewhat arbitrary, and you might be right on that. The numbers in that range, however, are not. The 1.5 came from a recent post from Krugman the other day where we extracted that from Okun’s Law. The upper end of that interval is where I believe the central tendency of the FOMC’s estimate has been for some time. I think it’s fair to say it’s under 2 percent since we’ve been growing at about 2 on average for a long period in which the unemployment rate was collapsing. Where exactly it lies within that range is highly debatable, but I believe–based on personal judgment, I’ll admit–that Sumner’s estimate is a bit too pessimistic. I could be wrong.
2. I don’t think that’s true. The estimate in that paper is that about three quarters of the cumulative drop is due to structural and demographic factors, while the remainder is cyclical. It’s a fairly old study, so the cyclical portion is perhaps less relevant in light of recent events (i.e., failure to rebound). The Krueger study is more instructive on this point, suggesting that even somewhat of a cyclical rebound would probably hold the LFPR constant if we account for demography. The BLS has produced significantly more pessimistic trends in that respect, attributed almost entirely to demography. There’s also research I’m aware of finding that LFPR rates, though generally acyclical–the financial crisis is surely an exception–typically rebound not long after we hit the trough of the business cycle; that suggests there’s hardly any chance of a rebound, I’d say.
3. Seems we agree on this.
4. As I understand it, Sumner accepts secular stagnation in two respects. One, he accepts that r* is historically quite low, which explains why interest rates are low–and not on ’emergency settings’ (hence his praise for Jim Bullard as late)–and, two, he believes that trend RGDP is far lower now than it was relative to its historical trend line, an argument attributed heavily to Robert Gordon. While I think Larry Summers’ arguments haven’t quite stood the test of time, Gordon has been fairly spot-on here.
To your last point: I certainly hope I haven’t done that, and I don’t think Sumner has. I think his argument is this:
A) Take the Clinton-era saying, “It’s the economy, stupid! People vote on pocketbook issues.” That sounds reasonably, and the modern liberal–not taking a side, but this is an honest assessment of the political discourse these days–and the modern Trump supporter (collectively ‘populists’) cited the plight of the average, blue-collar person, let down by the Obama Administration and sent into the arms of none other than Donald Trump.
B) If that’s true, the economy must have really stunk back in 2016, at the time of the election. If it didn’t, then why would people vote on pocketbook issues, i.e., if they were doing well? So let’s take as a premise that the economy stunk in 2016.
C) The economy in 2017 isn’t really much better in 2017 than 2016. RGDP growth was somewhat higher, which is great–Sumner is more generous than I am in attributing this to the tax cut, though I think all three of us agree that deregulation played a role–but job growth slowed. Why would job growth slow if the economy stunk in 2016, in which case we would expect faster growth consistent with faster RGDP growth? (See D for my answer to that.)
D) My answer to that, and I think this is the point Sumner was getting at, is that we’re facing labor-supply constraints upon approaching full employment. This is NOT to say that job growth was slower in 2017 because Trump is a bad president–that’s the argument Bernie Sanders made in his SOTU response–but rather than you can’t really have it both ways. You can’t say that things were horrid before Trump and amazing thereafter, but ignore the slower pace of job growth and laser in on a single indicator, RGDP.
E) Now, what’s a reasonable explanation for stronger RGDP growth? It probably isn’t stronger AD because then we’d have faster employment growth or rocketing wages. Most likely, it’s from the AS side, which is consistent with the narrative that it’s attributable to deregulation and tax reform, hence faster RGDP growth, hopefully stronger productivity–I’d have to check on this, but the effects on productivity are probably longer-term in nature–and, to the extent that productivity is higher, we’d expect a slower depletion of labor resources.
In other words, there’s a fairly plausible supply-side picture here: it just is totally inconsistent with the narrative amongst Trump supporters that economic anxiety and a ‘jobs crisis’ is what drove people to the ballot box to mark off Trump’s name.
The problem is, a lot of people–not accusing you in particular of this, though I hope you’re willing to look beyond your RGDP citation–do cherrypick numbers. One example is with the employment numbers, as I just explained. (Let’s ignore that Trump said these numbers AND the RGDP numbers were totally ‘fake,’ a ‘bubble,’ before he entere office, but totally real thereafter.) The second example is in stocks: stocks did quite well for most of the year–as they did under Obama–almost primarily, in my judgment, due to monetary policy. I think asset-price movements are always and everywhere a monetary phenomenon, or at least 90% a monetary phenomenon. Now, stocks have been plummeting, and they fell in the face of the jobs report. Do Trump supporters blame Trump for this? Nope! It was to his credit they were rising, but surely not his fault that they fell.
Now, if you buy into one side of this coin, it’s you that’s cherrypicking. I think looser monetary policy propelled stocks upward for most of the year, and expectations of tighter monetary policy this year, and perhaps expectations of greater probability of a fourth rate hike amid stronger job growth, is what sent stocks downward: a very basic correction, and nothing to see there, and symmetrically so for the upward stock movements.
I think Sumner has been extremely reasonable on all of these topics, so I’m really not sure of the basis for your assertion that he’s cherrypicking numbers to cover for his ideology–ironically, I think he agrees with parts of what Trump’s doing with respect to taxes/deregulation, as I do, but is too sophisticated in his thinking to accept A through Z without, rightfully, critiquing the nonsense in section M (higher deficits, for example; I’d cite giveaways to real estate built into the tax reform as well). I think Mankiw’s reply to this has been similar, and Brad DeLong suggested he was trying to cover for the GOP. It seems like people just can’t win in the Trump era….
4. February 2018 at 11:37
dtoh, I said:
“When you do so you see an economy that is gradually growing, a bit better than in 2016 (in my view due to better public policies), but not dramatically different from what was occurring during recent years.”
And I also said:
“Inevitably, some commenters will misread this post. They’ll accuse me of saying the economy is not doing very well, even though I never said the economy is not doing very well.”
Then you said:
“At a minimum it seems like a huge stretch to totally ignore RGDP growth and claim that the economy was no better in 2017 than 2016 solely on the basis of job growth numbers (and then have the chutzpah to accuse those with dissenting views of cherry picking numbers.)”
Who says I never make accurate predictions. 🙂
Seriously, the past four quarters have seen 2.5% RGDP growth. Under Obama, the 4 quarters leading up to 2015:Q1 saw 3.75% RGDP growth. Yes, 2017 was a bit better than 2016, but this growth is certainly nothing out of the ordinary, hardly even statistically
significantly different from recent years. Let’s wait until 2020 before making any sweeping judgements.
Lewis, Don’t make the mistake of drawing conclusions from a change in interest rates (i.e. reasoning from a price change). It totally depends on whether the higher rates reflect easier money or tighter money.
4. February 2018 at 11:45
Professor Sumner,
Okay, fair enough. I think I understand your argument that tight money caused the financial crisis, and is thus the proximal cause for 08. With that said, though, would it be fair to say that the financial crisis was what caused the substantial overhang in private debt? I think the distinction makes a lot of sense, generally speaking: if the Fed were to cause a recession tomorrow at a time when households have already repaired their balance sheets and banks are far better capitalized, there probably wouldn’t be a prolonged deleveraging process–to the extent that the recovery was prolonged, it would be 100% in the Fed’s court. But I think the effects of financial crisis, even if we take as a premise that they weren’t the sole or even primary cause of 08-09, would nonetheless be central to the rebound. I’m not quite sure what tools the Fed has to deal with an overhang in debt, other than I suppose encouraging refinancing. (But then we get into the trap of low rates = easy money, though surely low rates are at least beneficial insofar as they encourage refinancing and at least partially solve the problem of the vast number of underwater mortgages.)
4. February 2018 at 14:06
GDPNow @ 5.4%
4. February 2018 at 14:49
“Monetary policy was arguably far, far too tight, particularly in 2008”
That is an absolute understatement. One might think to consider just how far the real-estate bubble grew without there being any hint from the CPI. And once this occurred, one would have to remember what happened, so as on the downswing to not underestimate the beginning of the decline in real-estate prices.
Inflation and deflation can both seep into crevices (asset prices) that are underreported and not properly weighted (stemming from say, a decline in the exchange value of the US $ which may not have anything to do with a tight money policy, but stem from bad foreign trade polices).
What now no one seems to care about is the increase in money velocity.
4. February 2018 at 15:01
Fred, In my view the R&R finding reflected more than just debt. Debt crises don’t occur in a vacuum, but rather reflect a wide variety of factors. In most cases, the crisis is partly due to real factors, say the terms of trade turning against a country. The failure to get back to trend reflects the fact that the trend growth rate has actually slowed after the crisis But not due to the debt, rather due to the factor that triggered the crisis. (Think Thailand 1997, hurt by competition from China).
In contrast, when monetary policy depresses an otherwise healthy economy, the recovery need not be slow, even if there is a financial crisis. The US economy grew fast after the 1907 and 1933 financial crises, because it was a fundamentally healthy economy, just suffering from tight money (falling NGDP).
By December 1941, we were back on trend, whereas this time around I don’t think we’ll ever get back on trend. I believe the trend rate of growth has permanently slowed.
4. February 2018 at 20:22
@fred @scott
1. Deleveraging is almost always an indicator of bad monetary policy.
2. LFPR – Fred, I don’t think your characterization is quite right. The paper lumps cohorts into the structural/demographic heap, when in fact they are descriptive, not analytical and therefore of unknown cause. The authors themselves also admit the sparsity of data on the impact of extended recession on the LFPR and therefore the difficulty of characterizing the business cycle impact. Finally, I think from a political perspective it is the structural aspects impacting LFPR that are most at question.
3. One would think a recovery in the LFPR would see a much longer (perhaps very much longer) lag in response to expected policy changes than changes in U6.
4. “A bit better?” Scott, I’m not sure I would characterize a change which implies a 50% increase in output over a generation as a bit better. Whether it is statistically significant or sustainable remains (as I think we have previously agreed) something which we will have to wait to see. My own empirical (and admittedly anecdotal) observations suggest the opposite of the “secular stagnation” theory.
5. It seems to me that if capex has been depressed by structural (tax and regulatory) impediments over an extended period of time, that the removal (or expectation of removal) of those impediments could (or may inevitably) result in an increase in growth, which is initially capex intensive and with limited initial employment gains… especially to the extent that pent up capex is targeted at labor saving investments.
6. Without arguing whether the the 20 to 40% “unemployment” number is in the right range (or at least close when taking into account the normal pattern of political hyperbole), I think it has to be admitted that there is still unemployment not reflected in the U6 number resulting from sub-optimal structural and monetary policy under the previous administration. Trump’s argument is at least accurate in direction if not magnitude. And to the extent that we are unable to predict trend growth or understand the reasons for changes in the LFPR, assertions about the accuracy of the magnitude are at best speculation. If there were an unlimited number of fun, interesting, $200k/year low skilled jobs available, I think we would discover that the 40% number wildly underestimates unemployment. I’m not trying to make an ad absurdum argument, but merely to caution against taking the opposite (and equally absurd) position based on ad hominem sentiments and thereby dismissing the possibility that structural and monetary policy has seriously depressed employment and that there is in fact an opportunity for substantially higher growth than what Scott or the Fed is predicting.
4. February 2018 at 21:11
The creators of GDPnow literally wrote on the website that the projections are not anywhere near accurate until all relevant economic data is released, prior to the official advance GDP release.
Stop citing it when there are more than 7 weeks left in the quarter. Q4’s estimate was 7% in October and 1% in December. In January it was 2.8%, and a day later we got 2.6%.
4. February 2018 at 23:37
“But if that were the case then the Democrats should have done well in 2016.”
Hillary won the popular vote.
5. February 2018 at 03:07
@Fred
Oh and BTW, SWAG is short for a “scientific wild-ass guess.”
5. February 2018 at 06:14
@ Alec Fahrin: “Stop citing it when there are more than 7 weeks left in the quarter”
Money flows, volume X’s velocity, indicate the very same thing, a sharp acceleration in real-output. So stop talking shit when you don’t even understand what’s going on.
5. February 2018 at 06:20
@ dtoh: “It seems to me that if capex has been depressed by structural (tax and regulatory) impediments over an extended period of time”
Complete tripe. The drop in CAPEX is entirely due to the Keynesian macro-economic persuasion that maintains a commercial bank is a financial intermediary. There are 4 years of personal savings that are bottled up, idled, in the payment’s system.
In “The General Theory of Employment, Interest and Money”, John Maynard Keynes’ opus “, pg. 81 (New York: Harcourt, Brace and Co.), gives the impression that a commercial bank is an intermediary type of financial institution (non-bank), serving to join the saver with the borrower when he states that it is an “optical illusion” to assume that “a depositor & his bank can somehow contrive between them to perform an operation by which savings can disappear into the banking system so that they are lost to investment, or, contrariwise, that the banking system can make it possible for investment to occur, to which no savings corresponds.”
In almost every instance in which Keynes wrote the term bank in the General Theory, it is necessary to substitute the term non-bank in order to make his statement correct, viz., the Gurley-Shaw thesis, the DIDMCA of March 31st 1980 which directly caused the S&L crisis.
Lending by the commercial banks is inflationary. Lending by the NBFIs is non-inflationary, ceteris paribus.
5. February 2018 at 06:29
Inflation, when it exists, is the most perverse and perhaps the most disruptive economic force regulated-capitalism encounters.
Price-level targeting by the stagflationist advocates (those who would target N-gDp), is unwarranted. It has now produced, since the advocates banded together and wrote a letter to Janet Yellen, higher prices, a breakout in yields, a falling U.S. dollar, and a credit downgrade from China.
https://bloom.bg/2FIyHUQ
China Downgrades US Credit Rating From A- To BBB+, Warns US Insolvency Would “Detonate Next Crisis”
http://bit.ly/2r8igOI
“Today, a group of economists published a letter urging the U.S. Federal Reserve to consider a monumental change in policy: raising its target for inflation above the current 2 percent.” — Narayana Kocherlakota (June 2017)
Price stability is critically important (and is responsible for the length of the current expansion), but income redistribution is imperative to the survival of capitalism and our presumed constitutional freedoms.
Unless savings are expeditiously activated and put back to work, a dampening economic impact is exerted and metastasizes.
5. February 2018 at 06:38
Inflation cannot destroy real property nor the equities in these properties. But it can and does capriciously transfer the ownership of vast amounts of these equities thus unnecessarily accelerating the process by which wealth is concentrated among a smaller and smaller proportion of people. The concentration of wealth ownership among the few is inimical both to the capitalistic system and to democratic forms of government.
Calculating the rates-of-change, RoC’s in the CPI has been statistically exaggerated by the present practice of calculating the roc’s in terms of a reference base one year earlier, rather than from the base period of the index (where the Consumer Price Index is benchmarked to 100).
For example: using the base period for the CPI: 1967 = 100. One dollar in 1967 buys $7.49% in terms of base year prices (in other words, a very substantial absolute increase in prices). The base period changed in January 1988. Now the benchmark is 1982-84 = 100. (per BLS:“comparisons cannot be made between indexes with different reference bases”).
This metric assumes that the “market basket” for the CPI is “representative”. The BLS data is also seasonally mal-adjusted…though the data is up-to-date (published with c. 2 week delay) & reasonably frequent (monthly).
The CPI and PCE are political constructs, not economic ones.
5. February 2018 at 15:02
If Eliezer had posted that at LessWrong I could have commented on it, so instead I’ll complain here:
“The government legalist system is too expensive in time and money and energy, too unreliable, and too slow, for any sane victim of sexual assault to appeal to the criminal justice system instead of the media justice system or the whispernet justice system”
This is a terrible argument (and given the larger point he’s making, I hope he’d approve of me saying so). By it’s nature, it’s hard to get figures for the “whispernet” justice system, but Eliezer’s own book in inadequate equilibria points out how limited the amount of attention there is for the media to focus on issues for people to be outraged about (like large numbers of infants dying because of the formula used in most hospitals). The media disproportionately focuses on certain people, like celebrities (generally speaking) and college students (in the case of sexual assault, though they are less likely to be assaulted than their non-student peers). People actually do get convicted in the conventional legal system, you just haven’t heard of most of them. There’s a lot more of them than people who’ve lost their positions thanks to “the media justice system”. Plus, being convicted can actually prevent further assaults, whereas the whispernet around James Toback going back decades (there was also a Spy magazine article back then) didn’t seem to deter him at all.
5. February 2018 at 17:27
Hmm, last week, on Thursday and Friday, long-run TIPS spreads soared…….
https://fred.stlouisfed.org/series/T5YIFR
https://fred.stlouisfed.org/series/T10YIE
6. February 2018 at 04:15
Well, I am an EMH man.
There are days when being an EMH man and keeping a straight face is a trying proposition.
6. February 2018 at 05:04
I think the Fed chair change has something to do with this drop in stock prices, similar to late ’87. Nominal Treasury rates barely moved Friday and yesterday, but short-term real rates moved down yesterday. Perhaps the fact that the Fed targets inflation with no catch-up is part of the explanation. Markets are skipping a step and assuming Fed will not let inflation fall, though the NGDP growth trajectory falls.
Of course, much more straightforward to say perhaps there was a hit to real growth expectations and that this isn’t nominal at all.
6. February 2018 at 06:31
One of the weaknesses of Professor Irving Fisher’s formulation is that many transactions are effected on a “deferred payment” basis involving no immediate creation or transfer of money. This shows up as a spike in payments in January (a seasonal spike in money flows). That’s why, if the market should be sold short, you enter positions in approximately the 3rd week in January. But this year the spike, based on the distributed lag effect, appears to be in December.
Dec 28, 2017. 07:53 PMLink
The best time to sell short is approximately the 3rd week in January.
Dec 22, 2017. 05:07 PMLink
There are 6 seasonal, endogenous, economic inflection points each year. These seasonal factors are pre-determined by the FRB-NY’s “trading desk” operations, executing the FOMC’s monetary policy directives (in the present case just reserve “smoothing” and “draining” operations, the oscillating inflows and outflows, the making and or receiving of interbank and correspondent bank payments by and large using their “free”excess reserve balances).
Every year, the seasonal factor’s map (economic time series’ cyclical trend), or scientific proof, is demonstrated by the product of money flows, our means-of-payment money X’s its transaction’s velocity of circulation (the scientific method).
Monetary flows (volume X’s velocity) measures money flow’s impact on production, prices, and the economy (as flows are driven by payments: “bank debits”). It is an economic indicator (not necessarily an equity barometer). Rates-of-change Δ, in M*Vt = RoC’s Δ in AD, aggregate monetary purchasing power. Thus M*Vt serves as a “guide post” for N-gDp trajectories.
N-gDp is determined by the volume of goods & services coming on the market relative to the actual, transactions, flow of money. RoC’s in R-gDp serves as a close proxy to RoC’s in total physical transactions, T, that finance both goods and services. Then RoC’s in P, represents the price level, or various RoC’s in a group of prices and indices.
Monetary flows’ propagation, are a mathematically robust sequence of numbers (sigma Σ), neither neutral nor opaque, which pre-determine macro-economic momentum (the → “arrow of time” or “directionally sensitive time-frequency de-compositions”).
For short-term money flows, the proxy for real-output, R-gDp, it’s the rate of accumulation, a posteriori, that adds incrementally and immediately to its running total.
Its economic impact is defined by its rate-of-change, Δ “change in”. The RoC, is the pace at which a variable changes, Δ, over that specific lag’s established periodicity.
And Alfred Marshall’s cash-balances approach (viz., a schedule of the amounts of money that will be offered at given levels of “P”), viz., where at times “K” is the reciprocal of Vt, or “K” has the dimension of a “storage period” and “bridges the gaps of transition periods” in Yale Professor Irving Fisher’s model.
As Nobel Laureate Dr. Ken Arrow says: “all analysis is a model”.
-Michel de Nostredame
6. February 2018 at 06:43
The day after Trump won the election, people walked down the middle of the streets with rifles. Murder rates and social unrest are up. It’s simply because of bad economics.
6. February 2018 at 06:48
@flow5:
You wrote: “Inflation, when it exists, is the most perverse and perhaps the most disruptive economic force regulated-capitalism encounters.”
I think you’re reasoning from a price change here–this is only the case with higher inflation prompted by a leftward AS shift. Advocates of price-level targeting want an automatic stabilizer in the face of negative AD shocks in the hope of keeping expectations, and thus actual prices, stable–which is sort of a backdoor way of targeting NGDP, as the Fed has been implicitly doing for a while. Ironically, they’re more susceptible to price shocks.
@dtoh: I think the explanations they attribute the decline to are more than justified. Regardless, the best possible evidence against an LFPR rebound is that several papers published years ago, much like that one, predicted that there was at least somewhat of a cyclical component–but one in which was eclipsed by demography–and yet it has failed to rebound. If those workers constituted latent slack then, I think in the interim hysteresis has done the job. Mind you, wage growth was about 2 percent back then per annum; now, we’re averaging about 2.5, looking through the recent number which was probably aberrant. The elasticity would have to be remarkably low for a half percentage point rise in wages to have no material effect on labor supply at all.
You also wrote:
“I think it has to be admitted that there is still unemployment not reflected in the U6 number resulting from sub-optimal structural and monetary policy under the previous administration. Trump’s argument is at least accurate in direction if not magnitude.”
I find this argument to be rather silly, and it’s interesting to hold Trump to such a low standard: he was off by a factor of 40, but hey, he got the sign right! Even that is questionable, though. Most estimates of the natural rate are above 4 percent, so by such a metric we’re actually running somewhat hot at the moment. Monetary policy has no impact on structural forces unless you account for the indirect effects of hysteresis, which I assure you Trump couldn’t define. Structural unemployment also doesn’t constitute labor slack, nor would it enter into any reasonable definition of ‘unemployed.’ This isn’t to say that we’re necessarily at full employment–I don’t quite know–but to the extent we aren’t, we’re talking about a couple basis points. I bought the argument a few years ago that running hot might draw people back in the labor force. Now, I think it’s an excuse amongst PermaDoves to avoid having to change their arguments as the facts change.
(By the way, I should be clear on this definition of PermaDoves. I really mean people who think the Fed should still be at zero. We can argue about the rate path, but I think that argument really isn’t defensible at this point unless you really buy into the overheating story.)
You also wrote:
“I’m not trying to make an ad absurdum argument, but merely to caution against taking the opposite (and equally absurd) position based on ad hominem sentiments and thereby dismissing the possibility that structural and monetary policy has seriously depressed employment and that there is in fact an opportunity for substantially higher growth than what Scott or the Fed is predicting.”
I do think the example you gave was somewhat of an absurdity, but even so, I’m not denying that bad policy has likely generated some structural employment. Having a minimum wage, for example, is likely to generate unnecessary structural employment. The same is likely true for stabilizer programs, though I think some of those are justifiable. I think the hystereis story is reasonably valid, also, though I don’t think it’s fair to say that the Fed has intentionally induced it. Hindsight is 20/20, after all, and though we might reason that the Fed had the wrong framework at a time when a goal-based regime, such as NGDPLT, was clearly necessary amid a plummeting r*, the issue would have been far worse without it. Recall that estimates of the natural rate used to be in the high 5’s or low-to-mid 6’s back in the day. A 4 percent unemployment rate would have been unheard of at that time.
6. February 2018 at 08:52
Apparently George Orwell is alive, well and holding two contradictory ideas in his mind simultaneously, at Boston College;
https://economics21.org/html/new-chair-powell-should-enhance-fed%E2%80%99s-inflation-targeting-strategy-2832.html
‘Unemployment remains low and stable, economic growth continues to accelerate, signs of robust wage gains have finally appeared, and inflation, though puzzlingly slow, is still expected to return to the Fed’s two percent target over the intermediate term. Additional monetary tightening will be required against this most favorable backdrop.’
Followed later in the piece with;
‘Critics of the Fed are rightly concerned that, as shown in the graph, inflation has run persistently below the two percent target for more than a decade now. But Chair Powell can explain to those critics that, indeed, precisely because inflation continues to skirt the lower bound of its acceptable range, the Fed is holding policy rates well below levels that would ordinarily prevail at this stage of an economic expansion. Chair Powell could also point to a symmetric band around two percent as evidence that, consistent with their previous statement of longer-run goals and strategy, FOMC members take shortfalls of inflation below target as seriously as they do overshoots above.’
To which I, nauseatingly (?), remind everyone that this logic pretzel comes from treating interest rates as the ‘price of money’;
‘But, very much to her credit, former Chair Janet Yellen has already prepared the public for further rate hikes.’
6. February 2018 at 09:19
@Patrick:
The funny thing is, his idea reinforces the contradiction. If an acceptable range for inflation would allow inflation up to 2.5 percent, the Fed ought to be easing. The idea that the Fed would ‘tighten,’ but not as much, when it would just barely accept such an inflation rate is a bit baffling to me–especially when his definition of tightening looks to historical equilibrium rates, which are far higher than today.
This idea of a range for inflation has been brought up for a while, and it seems to me to constitute the single greatest attempt at shifting the goalposts I’ve ever seen: we ‘can’t’–hardly true, and he severely underestimates the role of expectations and the power of the Fed in achieving nominal variables–hit the bullseye in the middle of the dartboard, so we’ll expand the diameter of our acceptable range! Except, apparently, it isn’t acceptable, because it merits ‘loose’ policy by historical standards…
People say that changing the 2 percent target could cost credibility. I generally agree, but think a single regime shift, done well and timed well, could be effective. Ironically, this is the single shift that would (a) accomplish nothing and (b) concede that they aren’t even serious about hitting 2 percent.
6. February 2018 at 10:24
dtoh, You said:
“Deleveraging is almost always an indicator of bad monetary policy.”
In the US, I was talking about foreign countries. If they’ve borrowed in dollars, they can’t inflate away the debt. But for the US, I agree.
You said:
“I’m not sure I would characterize a change which implies a 50% increase in output over a generation as a bit better.”
Good, then you presumably also believe that similar changes under Obama had the same implications? Or would you say that the economy of 2014 was only a bit better than the economy of 2012? The latter is my view.
As far as the true unemployment rate being much higher, that actually weakens the argument for 2017 being a good year. Job growth slowed substantially in 2017, and yet faster job growth was Trump’s number one goal. Conversely my argument that we are near full employment strengthens the argument that Trump’s done well on jobs–we are running out of workers.
Wonks, Perhaps he should have said “sexual harassment”. Or “sexual assault as defined on college campuses.”
Scott, You said:
“Of course, much more straightforward to say perhaps there was a hit to real growth expectations and that this isn’t nominal at all.”
That’s right. Perhaps the 2.9% wage number led to fears we are running out of workers. (Not sure we are, but that might be a fear.)
Fred, The dual mandate implies that 2% is not always the target. If it were, then we’d have an ECB style single mandate.
6. February 2018 at 20:48
I’m not quite sure I agree with that. Surely the mandate allows space for short-term deviations from 2 in order to stabilize employment, but I don’t think that amounts to targeting, say, 1.5 percent inflation over any meaningful horizon (about 1-to-2 years out, I’d argue, and usually the horizon in Svensson’s papers).
The proposal, as I see it, is intended to say, “We’ll be fine with inflation from X% to Y%$. Some, like Rosengren’s, pick out a number in that range which can change over time. I’m more receptive to that, if only because it could–it probably wouldn’t, but we can dream–build countercyclicality directly into the mandate. Most likely, though, it would amount to allowing the Fed to get away with statements like, “Transitory influences continue to hold down inflation, but it remains within our acceptable range, so we aren’t very concerned.” We can throw the ‘automatic stabilizer’ of anchored long-run inflation expectations out the window. The range itself also is incredibly large — 1.5 to 3 percent, I recently read?! It really isn’t much more than ceding ground to people who want to make excuses for why the Fed has been so bad at achieving its targets in a timely manner, most of which is predicated on the notion that it *can’t* be done.
All the benefits seem to me to constitute regime shifts unto themselves. While in theory the ‘optimal’ inflation rate might change, I think the only sensible way to do this–I think you’d agree–is with an NGDP targeting framework where movements in the underlying inflation rate directly offset movements in trend RGDP growth.
6. February 2018 at 20:48
OT
http://econlog.econlib.org/archives/2018/02/beckworth_inter_2.html
I am banned from Econlog, so I will comment here.
Good post on Kashkari and policy.
I still wonder given the Rube Goldberg-esqe on LSD complexities of monetary policy tools today, if simple helicopter drops are a better answer.
Certainly if democracies require transparency, then helicopter drops are an obvious choice.
Even professionals disagree on the effectiveness of conventional monetary policy tools, which require years to even understand and know about. IOER? The reverse repos? Bank reserve requirements? The Fed funds rate? The FOMC membership, including mysterious regional presidents? QE? Various regulatory tools, such as the riskiness-ratings of bank debt? The size of the balance sheet? (I probably missed a few tools…this takes constant practice….)
Would any honest public servant (when not taking acid) design from scratch the modern Fed system? Did the modern Fed evolve like a tree in cramped quarters—throwing branches up wildly to survive, from an initially crooked position?
And also: Let’s give up on up fiscal policy. There is no fiscal policy. There is only $1 trillion a year in deficit spending for the next 10 years.
What if helicopter drops can prevent the national debt from ballooning out of control? Don;t borrow as much, go to helicopter drops.
7. February 2018 at 02:32
https://www.nytimes.com/2018/02/07/magazine/the-rise-of-china-and-the-fall-of-the-free-trade-myth.html
The above is a fascinating article. Conventional macroeconomists tend to eschew nationalism and activist state economic agencies, and perhaps correctly so (certainly correct in theory).
But what if humans are not only homo economicus? What if they need to have pride in city state or nation, or culture or ethnicity?
The Far East has risen not on free trade models, but on mercantilism and state planning.
What if smart state planning does work better than rampant consumerism?
7. February 2018 at 09:29
One more point I should have included earlier.
I predict–correct me if I’m wrong–that you might counter by saying: “Whether long-run inflation is anchored isn’t a big concern or necessarily good because the nominal variable we care about is NGDP, which might require some deviations in expected inflation averaged out over some horizon.”
This is, I think, a very good point. I think the best argument I might make in response is that, though I agree inflation is a far less significant variable, movements in inflation expectations driven by monetary policy are necessarily the byproduct of, and require, movements in expected NGDP. If inflation expectations fall, it’s because NGDP expectations fell. The Fed, with such a range, isn’t stating that it will keep the NGDP target constant and vary the composition of P and Y–it can’t do that, obviously; that’s dependent on AS factors–it’s stating that it’s NGDP target is so variable that it can make virtually no commitment. Pick an inflation rate, any one, which amounts to choosing an unemployment rate for them as well because they believe in the Phillips curve framework, and by force of will usher in deliberately overly tight money. (I can’t imagine that this is a symmetric distribution of outcomes, though surely this could in principle be used to justify overly loose money.)
The ultimate point, though, is that I think financial markets will view this as yet another attempt by the Fed to avoid taking its targets seriously, which seems rather contrary to the initial basis for inflation targeting.
8. February 2018 at 13:44
Normal people tend to credit themselves for successes and blame others for failures. Politicians do this strategically and deliberately. Normal politicians will promise a world of happiness and sunshine if they win, and will hype a doomsday scenario if they lose. None of this is remotely unique to Trump.
Trump evoked doom and gloom with “American carnage”. The Democrats have evoked similar maximum outrage and hysteria over absolutely every political issue, from fracking, to oil pipelines, to rollbacks of Dodd Frank, to rollbacks of EPA regulations, to any change in health care, to any changes in tax reform, to Betsy DeVos’s educational initiatives, to any moderation on immigration. Literally, every single one of those issues has been framed in the most extreme and dramatic, end of days, language possible by opponent Democrats. Even the rollback of obscure net neutrality regulations has promoted the similar widespread hysteria and cries of doomsday and death threats.
You can’t judge a doctor or a medical treatment by the outcome of a single patient, just like you can’t judge a President by the overall success of the economy that depends on many factors other than the president.
Beyond traditional economics, Trump is an emotionally motivating leader to many Americans, that will have genuine beneficial impact.
8. February 2018 at 15:29
Scott,
“I’m not sure I would characterize a change which implies a 50% increase in output over a generation as a bit better.”
Good, then you presumably also believe that similar changes under Obama had the same implications?
If it’s a change in the trend rate, then yes. If it’s a blip at the tail end of lethargic recovery due to slightly less inept Fed policy, then no.
8. February 2018 at 15:54
@Fred
You said, “Monetary policy has no impact on structural forces unless you account for the indirect effects of hysteresis, which I assure you Trump couldn’t define. Structural unemployment also doesn’t constitute labor slack, nor would it enter into any reasonable definition of ‘unemployed.’ “
I think maybe you missed the point. Only the harshest Trump critics would have construed his remarks as a comment on the accuracy of U6. The more reasonable interpretation is as a critique of the official unemployment number as an appropriate measure of unemployment because it ignores large numbers of people who are unemployed for structural reasons.
And I don’t think “we’re talking about a couple of basis points.” The drop in the LFPR equals 12 million people, which applied against the labor force as a denominator is roughly 700 basis points. And….if you believe that even at peak LRP there were significant structural factors inhibiting employment, then it’s an even bigger number.
8. February 2018 at 15:55
Massimo, You said:
“Beyond traditional economics, Trump is an emotionally motivating leader to many Americans, that will have genuine beneficial impact.”
History tells us that it’s not a good thing when the public is “motivated” by a pathological liar and a bully. Fortunately, Trump is one of the most unpopular presidents.
Back in late 2016 Republicans told us that “Yes, Trump’s a bad person, but we must vote for him because of Hillary” What the excuse for defending him now?
dtoh, But the data for Trump is no different from the 2014 data for Obama. So the argument has to be based on faith. That’s fine, but optimists should not be pointing to the current data as being statistically significant.
8. February 2018 at 16:36
Scott,
I’m not claiming 2017 data is different than the Obama data. It may very well be a blip as well. But on the other hand, it’s not entirely faith based. There are some specific factors such as de-regulation, tax cuts, dismantling of Obama care that should lead to higher growth.
8. February 2018 at 18:34
dtoh,
I don’t know how else we would interpret it. People like Bernie said that the ‘real’ unemployment rate was 10 percent. This is wrong for the reasons I posted. Trump said the unemployment rate was something like 20 to 40 percent. I think he was using the non-employment to population ratio (or, at least, that what his defenders on CNN argued; that’s misleading for a large number of reasons we discussed, and on which I believe we agree). With that said, his arguments were a repudiation of the U6 number… unless my math is quite bad, 40 is much greater than 10. I think his critique was far less thoughtful than arguing that the U3 might be a tad misleading. If that were the case, he’d be screaming about marginally attached and involuntary part-time, but I don’t believe he ever uttered the words. So I really don’t know what your point was… what he was saying came from crazy, far-right blog, I believe, and was conspiratorial in nature, much like a lot of the stuff he sees. (See all the crazy statistics he retweets.)
I’m not familiar with that 12 million number, but let’s suppose it’s right. We discussed what much of that decline is due to. I’m also not sure if you can compare the numbers, as you have, as it doesn’t quite account for population growth (i.e., when particularly are you making that comparison?).
Regardless, the ratio doesn’t quite carry over to the U3 as the magnitude of the numerator is obviously far different–not to mention, with a 4 percent unemployment rate…. we can’t really subtract 7 percent, for obvious reasons. Maybe I’m not quite getting this: are you saying we should be working with an 11 percent unemployment rate in mind? That seems rather drastic… I suppose you might accept that at least some is structural, so it’s somewhere in that range, though even then I don’t think the computation directly translates into the U3.
8. February 2018 at 22:31
@Fred
LFPR dropped from a peak of 67.3% to about 62.6% at the time of Trump’s comments. Applied against the Civilian Adult (non-institutionalized) population, that’s a 12 million drop…. (roughly equivalent to 7% of the civilian labor force) in the Obama years alone. Add that to the 5% official employment and your at 12%. If you add in the 3 million young (mostly African American) men in prison, some percentage of the 20 million students being subsidized to attend college and university, the poorly educated squeezed out of work by minimum wage laws, and the stilted growth resulting from high taxes and excessive regulation, then you are easily over 20% even backing out the demographic factors.
I’m not saying U3 or U6 are inaccurate, they’re just not the right measure of unemployment when you have 20 or 30 million people sidelined because of bad government policy.
9. February 2018 at 06:09
@dtoh:
Okay, thanks for the details on the calculation. Here are the problems I see with it:
(a) That peak is cherrypicked. I had to go back April 2000 to find 67.3%. The LFPR had been falling since 2000, though surely accelerated in 2008 when the baby boomers turned 62. It’s very difficult to make the case that after 8 years and a clearly robust economy, there this number represents labor slack–not to mention, this is 67.3% of the 2000 labor force, not of the 2008 labor force, so with population growth the denominator obviously grows. For this reason, I’m going to take the peak LFPR from 2008, 66%, right before the crisis.
(b) I’ll take December 2007 as the starting point. The civilian labor force at that time was 153,918 (thousand). That fall in the LFPR is at least half demography to its current rate of 62.6% — statistically indistinguishable from your rate, mind you, and it lets me take the civilian labor force at the time — so, with a current labor force of 161,115 (thousand) the difference with these two participation rates is 5316.795 (thousand). About half of this is demography, but let’s say that I grant you the other half–I shouldn’t because there are a whole lot of other reasons (those papers are instructive on this point: disability, education premium, hysteresis, early retirement in some cases, etc). So let’s take this with different scenarios:
Scenario A (Crazy Scenario): I grant you the entire decline: 3.3% of the labor force, so with a 4.1–not 5–percent unemployment rate, that’s an unemployment of 7.4 percent, not 12.
Scenario B (Adjusted for Demography): If I only take half of this, we add 1.65% to the unemployment rate, so we get 5.75%.
Scenario C (Aaronson et al’s estimate): Say that three quarters of the decline is structural. Then this adds only .825% to the unemployment rate, so we get 4.925%. The Fed thinks the natural rate is around 4.5 percent, so this is only a small gap, even if I grant you this, without account for forecasted demography.
Note that both Krueger and Balakrishnan et al (2015) argued that the LFPR will continue to decline due to demography. The same is true for the BLS, whose projections place us below 62 percent by the end of the decade.
That 3 million number I’m not aware of, but note that you would be increasing both the numerator AND denominator, so we’re not just adding that on top. There are a whole lot of reasons that even adding those back in is a stretch, and some of your explanations (e.g., high taxes) are dubious at best.
In other words, there is absolutely no reasonable way, without really playing around with these numbers, to get 20%.
9. February 2018 at 08:50
@Fred
1) I don’t think I was cherry picking. By definition there is only one peak.
2) The adjustment because from changing the denominator AND the numerator is relatively small… less than a half a percent even if you’re talking about 12 million people (3bp if you’re talking about 3 million).
3) The denominator of the LRPR is the adult population not the civilian labor force so you can’t apply the LFPR delta to the labor force without multiplying by the ratio of the adult population to the labor force.
4) The most recent published unemployment rate was not 4.1% at the time Trump made his comments.
5) I don’t dispute that demography plays a role in the LFPR drop. Again though I think you’re missing the point, which is that there was a significant non-demographic drop in the LFPR, and a strong belief (at least on the part of free-market proponents) that even at the peak before the drop, LFPR was significantly depressed by structural (bad policy) factors. That said, there is certainly room for debate as to the magnitude of the impact, but I suspect that debate would just lead to the normal free market vs. big government ideological stalemate. E.g. I would respond to your argument “that there is absolutely no reasonable way, without really playing around with these numbers, to get 20%” by saying that “there is absolutely no reasonable way” that anyone who had an actual understanding of human behavior and how business works could possibly believe that real unemployment is less than 20%…..i.e. not a very productive or congenial discussion.