

2001: A Market Odyssey (Shiller out of sample)
Any fool can data mine and find spurious correlations. The real test is how they do out of sample. Robert Shiller became famous in 1996 with his “irrational exuberance” claim (or at least one degree of separation from famous, as it was when Greenspan repeated this claim that the public took notice.)
Shiller’s model looks at the ratio of stock prices to an average of inflation-adjusted earnings over the previous 10 years. When he made the call this ratio was near the mid-20s, well about the historical average of 16. So how’s this model done since?
Not well at all. I just saw the S&P hit 2001 as I wrote this. Back in 2010 his model was telling us that the S&P was 20% overvalued, when it was at 1070. Take a look at the ratio over time.
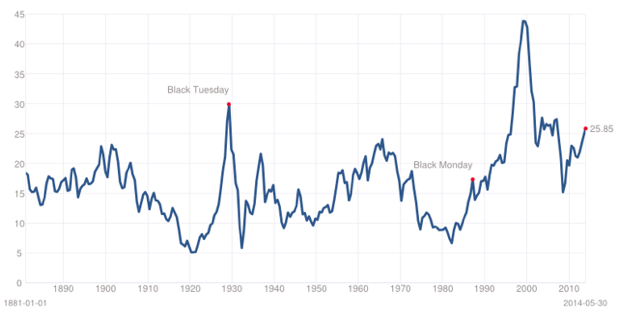
What do you see? I see a trend line that seems to have shifted upward from 16 in the mid-1990s, precisely when he made the irrational exuberance claim. The new average looks like about 25. And the current ratio is above 25. So the out of sample test was about as complete a failure as one can imagine. The model simply did not perform out of sample.
A few other points:
1. Shiller says that he is still buying stocks at extremely lofty values in 2014, even though in 2010 the S&P was already way overvalued at 1070. Huh?
2. Shiller was just awarded a Nobel Prize in economics. Not for creating a new model like the EMH, but rather for arguing that the EMH was wrong. But his alternative model has performed poorly in the 2 decades since it was first made famous. I guess the standard for experimental proof is a bit weaker in economics than in chemistry or physics.
PS. Of course I am not claiming Shiller is a “fool.” When I first saw his model I thought it was the most impressive anti-EMH model out there. The EMH needs to be challenged by the very best, and challenged frequently. But in the end I suspect the EMH will always come out on top, as other models fall by the wayside.
PPS. The Sumner model: 25 is the new normal for the PE10 ratio. Until it isn’t.
Tags:
25. August 2014 at 09:30
Maybe Shiller is a hack, not a fool.
His and Fama’s “official” views are polar opposites. Yet they invest the same. Both invest as if the EMH is almost true, though small exploitable violations like the size/liquidity/value premiums exist, which Shiller tries to harvest.
But the key difference: “Shiller’s primary quarrel with Fama’s views is his concern that fiscal authorities will be influenced by them in setting economic policy.”
Somehow, Shiller doesn’t trust his own Nobel Laureate self to spot bubbles, but the government- with its perfect incentives, and flexibility and meritocratic selection processes- can.
25. August 2014 at 09:36
25 I think will prove to be far too low.
Equity risks premiums are still extremely high compared to the natural real rate of interest.
You have 30 year tsys yielding 3%. 10 year tsys might be better proxy at 2.4%. What should the equity risks premium be? With the larger bond market indicating the real return to savings is lower it leads me to believe the sustainable equity premium is much higher.
As an investor I’m positive I will do better in equities at the current P/E of 17 or so than I will investing in 10 year tsys at a 2.4% yield.
Judging by interest rates I think the equity market P/E could be at 25 and still offer a fair risks premium compared to interest rates.
25. August 2014 at 09:41
Cant say much about stock markets, but I can tell you EMH sure seems to apply to the NFL betting market, which I have studied in considerable detail. There does seem to be a small window of opportunity on wednesdays early in the season, but this fact actually supports EMH given the way that market works.
25. August 2014 at 11:22
Elected officials seem to be the only real exception to the EMH.
25. August 2014 at 11:31
Well, at least according to this indicator, we aren’t due for a recession (whether the market is overvalued or not):
http://informationtransfereconomics.blogspot.com/2014/08/are-interest-rates-good-indicator-of.html
This exploits one of Shiller’s findings: there are long run trends in market data (one way to put it is that the EMH says prices are maximally uninformative, but not completely uninformative).
25. August 2014 at 11:37
It may well be that CAPE is currently high because the equity premium will be lower going forward. Which, as Sean points out, wouldn’t really be surprising.
But even if the realized equity risk premium doesn’t fall, there are still some reasons to believe that CAPE should be higher than past averages, including numbers 2,3, and 4 here:
http://marginalrevolution.com/marginalrevolution/2014/08/from-the-comments-on-bob-shiller-and-cape.html
25. August 2014 at 12:18
When I was an undergrad, I did a project that updated Shiller’s PE ratio work. My partner and I found what you did; PE Ratios were poor forecasters of returns and also fail the Granger-Causality test. We looked at 1, 2, 5, and 10 year PE’s against 5, 10, and 30 year S&P500 returns.
25. August 2014 at 15:18
In his recent NYT op-ed, Shiller acknowledges that something is wrong with CAPE. He asks, could it be low interest rates, and then wanders off. The answer is low interest rates, which are captured by the equity risk premium. The equity risk premium is not a buy-sell signal, but it is an intrinsic value signal. The leading proponent of the ERP, and the publisher of a monthly estimate, is Aswath Damodaran at NYU. The street calculates ERP but jealously guards the results since it has proprietary value. Fernando Duarte at the NY Fed has published two papers on the ERP, both of which are consistent with Damodaran. However you calculate it, the ERP has been quite elevated since the Crash–as it was after the Depression. The investor is still shell-shocked by 9/08-3/09, and is being seriously mislead by the punditocracy which keeps telling them that “stocks are high”. Consequently, the ERP remains high (5.45% per Damodaran) which means that even if you’re late, you can still join the party. The reality is that (1) stocks are undervalued and (2) earnings growth is keeping pace with price appreciation. Thank God for market inefficiency; I have made a lot of money being bullish lately.
25. August 2014 at 15:21
So instead of a static(15 or 25 [(stock price)/ (inflation adj earnings)]…does 10 year moving average target work better and in a more robust way?
I may be to simple minded, but seems like a common sense adjustment to try.
25. August 2014 at 15:22
An addendum: the ERP is high because term rates are low. If term rates rise, the ERP will decline. Therefore the call is the outlook for bond yields. Given current observed and expected inflation, as well as QE exit and reversal, I would not bet on rising bond yields. And indeed, they have been falling since last year.
25. August 2014 at 16:04
Sumner, you’re not actually providing any alternative model. Saying “25 is the new normal for the PE10 ratio. Until it isn’t” is not a model that can be tested out of sample. It is just the aphorism “whatever happens, is supposed to happen.”
It is in fact data mining. The model IS the data.
25. August 2014 at 16:30
Regarding EMH, the capital markets could not work if investors adopted it as a means to investing. The capital markets can only function if investors think EMH is false and act on EMH being false.
Any idea that if adopted would collapse the very thing it purports to describe, cannot possibly be anything but a false description.
Investors for the last 200 years at least have believed they can “beat the market”, and that is because it can be beat. This doesn’t mean there is a scientific formula however. Any formula that is purported to serve as a means to permanently beat the market, would eventually become “absorbed” into the market, and we would again hit the barrier of “the market can’t beat itself.” But that is what the market IS. It is a continuous process of new ideas and new methods and new techniques constantly being introduced and implemented so as to enable those who innovate to take step ahead of other investors.
The market is constantly “inefficient” in the sense that at any one time, there are opportunities for beating the market. The opportunities require a given investor to introduce an improvement, a new technique. One and the same investor can in principle continuously beat the market, as long as they succeed in continually introducing new techniques and continually staying a step ahead of the average investor. Not impossible.
25. August 2014 at 16:56
Nice post. I have always puzzled at Shiller’s backward-looking CAFE.
Low interest rates may be the new norm.
That said, I wonder about elevated pe’s. EMT rules…but pe’s above 10-12 are essentially optimistic…
Would you buy a bar for $1.5 million that netted $100k?
26. August 2014 at 05:41
@benjamin cole,
I think the bar investment you describe is a lot riskier than an investment in the S&P 500.
26. August 2014 at 07:07
Sean, Maybe, but if so my model will still beat Shiller’s!
Ben, The problem with bars is that they are riskier than an index fund, and much more time-consuming to manage.
26. August 2014 at 08:53
I think you have the gust of what I was saying.
ERP is normal to high compared to last decade though P/E is probably back to normal or slightly high.
I do believe for global structural reasons the real interest on money is lower today than it has in the past (high Asian Savings rates, wealth inequality, etc). So that will lead to high valuations across markets.
I do think interest rates right now are a little to low as Yellen will likely inflate the economy more than the market is pricing in.
26. August 2014 at 16:49
Sumner:
“but if so my model will still beat Shiller’s!”
What alternative model is that? There isn’t any in this post.
26. August 2014 at 20:42
Simple fact is that Shiller correctly predicted 3 of the last 3 bubbles (2000, housing, 2007). The Prof and the commenters are both trivializing and mischaracterizing his work by putting CAPE at the heart of it. It’s not about that at all. He made that precise point in the NYT piece. CAPE is simply one of several metrics he uses to estimate the degree to which social/psychological forces are at play in bubble creation. He also says that these things can go on for a long time, which is why he is still in equities — that and the fact that he is now rich enough to enjoy the gambling instinct. Noting “huh” about that.
26. August 2014 at 20:59
Scott,
Do not get me wrong, I have a lot of admiration and respect for Shiller as well, but I must say that CAPE even in sample has been a poor predictor of real US stock market returns.
I can send you the manipulated raw data if you wish. Below, is an image of a graph that I made from raw data of S&P 500 and dividend nominal returns, 10 Year Treasury nominal returns, CAPE, and Q-Ratios pulled from Shiller’s Excel raw data file (http://www.econ.yale.edu/~shiller/data.htm and http://www.econ.yale.edu/~shiller/data/ie_data.xls) and FRED (FRED data sets MVEONWMVBSNNCB and TNWMVBSNNCB for the Q-Ratio) showing what the 10 year following geometric real return (S&P 500 + Dividends 10 year geometric nominal return less the 10 Year Treasury geometric nominal return) does in terms of R^2 fit with CAPE and Q-Ratio predictors at the beginning of each 10 year period and the fits are very poor for both — 0.3 or less R^2 even for 150%+ geometric mean only samples. I added Q-Ratios in since these are often brought up along the same argumentative lines as CAPE.
http://s12.postimg.org/wisgumeel/Cape_Graphs.png
This weak correlative predictive fit of CAPE exists before even getting into alternative causalities for each market “crash” allegedly predicted in sample by CAPE such as poor monetary policy, asset allocation changes, or changes in future estimated discounted value residuals on top of presently valued assets.
P.S. I have been a lurking non-commenter on your blog for years. I think this the second time that I have ever posted on it, haha.
27. August 2014 at 03:42
You can explain the entire observed evolution of the price of gold from 1970-1984 using ‘irrational exuberance’ and bubbles–making no reference to inflation or Bretton woods. In fact, now that iI think about it, you can probably describe the inflation rate in the 70s as a kind of ‘animal spirit’ … But why?
27. August 2014 at 05:46
Sean, I mostly agree.
maynardGKeynes, I don’t agree with the claim that he predicted the 2000 and 2007 bubbles. I should do a post on that. The predictions were made in 1996 and 2003, at a time when valuations were reasonable. If you say “bubble” every single year then eventually you will look right.
David, I don’t know enough to contest any of your specific claims. But how about the fact that people like Fama accept Shiller’s data, but simply interpret it as a change in the risk premium. Is Fama being too generous? He must be aware of the empirical facts.
And come back more often.
27. August 2014 at 08:36
Scott,
“David, I don’t know enough to contest any of your specific claims. But how about the fact that people like Fama accept Shiller’s data, but simply interpret it as a change in the risk premium. Is Fama being too generous? He must be aware of the empirical facts.
And come back more often.”
Beyond Fama’s general EMH views, I am not knowledgeable about what Fama specifically has said about CAPE in regards to “accepting Shiller’s data” and could not find comments of his on CAPE after a brief Google search. Assuming what you are saying is correct about Fama accepting Shiller’s data and taking this “accepting Shiller’s data” to mean accepting that CAPE in sample has good correlative fit with prospective nominal returns, I would guess that Fama is maybe not referring to CAPE and its fit in correlating with prospective real returns in sample, but just prospective nominal returns fit with CAPE in sample — which fits somewhat better. Fama’s change in risk premia argument would certainly take the thunder out of CAPE as a predictive tool in either the real or nominal returns cases as they relate to CAPE, however.
If all of the above assumptions are correct, maybe there is a reason that Fama is choosing to use nominal returns for the returns sample tested with CAPE as opposed to real returns? Certainly, most of the popular debate on CAPE surrounds, incorrectly in my opinion, testing CAPE against nominal returns. Regardless, I do think that real returns are the best way to evaluate, in or out of sample, any alleged macro-market valuation market predictor metric, since real wealth accumulation over time is what ultimately matters with investing. So, all of the above being true, I think that Fama would be acting too generously towards CAPE.
P.S. Shiller and Fama are geniuses in their fields and have extremely high academic integrity, so please do not let anything that I have written above make you think that I believe otherwise. Just because we consider someone wicked smart in their field, however, does not mean that we have to agree with them though of course.
P.P.S Scott, I will try to post comments more often, thank you for the invite! Often I read your blog on my phone while commuting though, so it is tough to post empirically thorough responses that way and not on a PC. Do not think that I have not been tempted to comment many times on here though when ultimately I have not! Between your excellent blog, Krugman’s, and Murphy’s, I feel that I get a solid Weltanschauung of the current MM, Keynesian, and Austrian macro-economic dialectic!
28. August 2014 at 11:33
David, Thanks for that response. Because I am now almost always short of time, I rarely am able to follow up with an investigation. In the finance area I just comment on what I read. My point is that Fama’s paper in the June AER talks about Shiller’s findings, so if you are convinced you have seen something important I’m sure Fama would be very interested. He tried to dismiss Shiller’s results by saying they fit with the EMH, it’s just that expected returns fluctuate over time. But it seems you are making a stronger argument against Shiller.
And I agree that both are brilliant people.