

Short notes
1. The market monetarist view that tight money caused the recession is getting some play in the press. Here’s an excellent piece by Ramesh Ponnuru:
There’s another view of the Fed’s role in the crisis, though, that has been voiced by economists such as Scott Sumner of Bentley University, David Beckworth of Western Kentucky University and Robert Hetzel of the Richmond Fed. They dissent from the prevailing view that the Fed has been extremely loose since the crisis hit. Instead, they argue that the Fed has actually been extremely tight, and that when its performance during the crisis is measured against the proper yardstick, the central bank emerges as the chief villain of the story.
In the second half of 2008, housing prices, many commodity prices, inflation expectations and stocks all suggested deflation was coming. Fed officials, though, kept talking about backward-looking measures of inflation that made it look high. Their hawkish pronouncements effectively tightened monetary policy by shaping market expectations about its future direction. In August 2008, the Fed minutes explicitly said to expect tighter money. Even after Lehman Brothers Holdings Inc. collapsed the following month, the Fed refused to cut rates and fretted about inflation (which didn’t arrive). A few weeks later, the Fed decided to pay banks interest on excess reserves, a contractionary move. Only then did it cut interest rates.
2. A few comments on the unit root debate in the earlier comment section. I probably erred by leaving the impression I was a big “unit root” fan. I just thought it was interesting to update the proposed bet now that 5 years has passed. I do think there are interesting studies that suggest something close to a unit root, but also think there are stories that are consistent with demand shocks still having a transitory effect on output. But give the unit root people kudos on one point. It seems to me that the theory has done better “out of sample” than in sample, which is pretty rare in macro. (The fact that it’s rare suggests a whole lotta data mining is going on.)
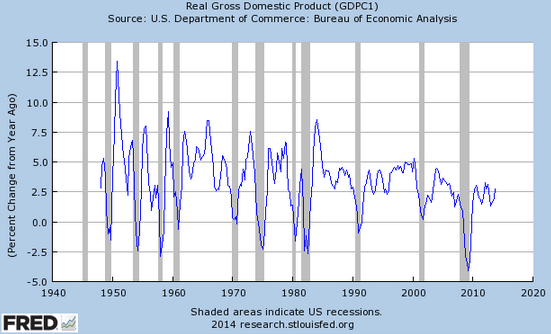
This claim is non-scientific, but look at this times series of RGDP growth. The 1950s sure look like trend reversion to me. What would a unit root look like? Perhaps a recession would be followed by slower growth than in the preceding cycle, and hence no recovery to trend. This seems to be roughly true of the last several recessions, doesn’t it? That’s out of sample success.
3. In the discussion of Ben Bernanke’s performance a lot of people thought I was too kind, as I expected. Perhaps the following analogy I left in the comment section helps. BTW, this is why I believe that history as a field is fundamentally “wrong,” even though I have enormous respect for the field of history:
Suppose someone else had been elected in 1928 (not Hoover). Say Coolidge. And suppose that because of the policy differences from this counterfactual president the Great Contraction of 1929-33 was only 2/3rds as bad. That person would have been a GREAT president. And yet ALL historians would have said he was horrible. That’s what people miss.
Why do I have great respect for history? Because historians still come up with great insights under very difficult circumstances. Learning lessons from history is incredibly hard. Quite a few alternative monetary policies in the interwar period, either much more liberal (Keynesian/monetarist) or much more conservative (Austrian), would have been better than what actually happened, and yet would probably be viewed by historians as a failure. They never would have known that the monetary policy in the universe we happen to live in was an unusually bad draw. But the circumstances of the interwar period were so bad that most draws were on the bad side. Just as most possible post-1933 governments in Germany would have been bad, but again this universe happened to end up with an unusually bad draw. I think historians understand this problem, but in the end it is still too much to overcome in many situations.
[On the other hand the post-WWII draw was very good—no nuclear war (knock on wood.)]
4. Here’s an interesting video by Dan Klein showing where the word liberal came from. Adam Smith plays a role.
Update: This Marcus Nunes post relates to the unit root issue.
Tags:
1. February 2014 at 12:03
No comments on “Petroleum Derangement Syndrome”?
1. February 2014 at 12:56
Okay, I have a question-thought, that might make a good blogpost (in light of MM, QE and tapering).
Some say the size of the federal debt does not matter but I think too big is bad. Okay, but what about the size of the Fed’s balance sheet?
The Fed is very averse, nearly squeamish about having a large balance sheet. But does it matter? What if the Fed ran the balance sheet up to $5 trillion and kept it there for 15 years?
I see taxpayer burdens with bigger federal debts…but benefits for taxpayers with bigger Fed balance sheets…
Is the Fed’s aversion to “large” balance sheets appropriate in deflationary environments?
1. February 2014 at 13:16
Professor Sumner,
I’m not sure exactly what you meant when you said: “I do think there are interesting studies that suggest something close to a unit root, but also think there are stories that are consistent with demand shocks still having a transitory effect on output.”
Mankiw, in his response to Krugman’s ‘Roots of Evil’ post, states that he does believe in some reversion to trend after a recession — transitory demand effects. The unit root is not based on economic theory, but rather on pure econometric forecasting. The story is that, in a recession, things can get better but also things can get worse. One scenario may be rapid growth in RGDP back to trend, but another story is a worse recession or a prolonged recession. Just because rapid growth is more likely in some sense than usual, doesn’t mean that the mean forecast should be higher.
1. February 2014 at 13:21
Travis, Can you be more specific?
Ben, Not appropriate, especially since a bigger balance sheet in the short run would make it smaller in the long run.
J, Why does that argument not apply to unemployment, which does not have a unit root?
1. February 2014 at 13:37
Prof. Sumner,
Real growth has increased substantially since 2011. How much of that increase is attributable to the Federal Reserve and how much of that increase is attributable to the huge new oil discoveries we’ve had recently?
1. February 2014 at 14:20
RGDP time series might have a unit root and RGDP %change might not at the same time. In other words, the RGDP growth may have some reversion to trend mechanism, but RGDP itself not and we simply continue with the same rate from the new level.
1. February 2014 at 14:34
“And yes, Europe is very much in a trap. Inflation is falling because the economy is weak, and the economy is being weakened in part by falling inflation. That’s the Japan syndrome. It leads eventually to actual deflation, but to the extent that there’s a red line (or more accurately, an event horizon), it’s crossed when monetary policy starts being limited by the zero lower bound, which happened years ago.”
http://krugman.blogs.nytimes.com/2014/01/31/the-low-inflationary-trap/?_php=true&_type=blogs&module=BlogPost-Title&version=Blog%20Main&contentCollection=Opinion&action=Click&pgtype=Blogs®ion=Body&_r=0
“Years ago”… Someone should ask Paul Krugman to pinpoint the time when the eurozone encountered the zero lower bound. That’d make for an interesting twisting of the facts
1. February 2014 at 15:02
If you look at a chart of NGDP and RGDP:
http://research.stlouisfed.org/fredgraph.png?g=rAA
You can see that changes in RGDP growth have been almost perfectly correlated with changes in NGDP growth.
It is so incredibly tempting to conclude that if those periods of falling NGDP were reversed via inflation, then RGDP would not decline either. Sure, this might be true, but only in the short run. Once the money is absorbed into the spending stream, the problems that additional inflation covered up, are still there. And in order to prevent the corrections from taking place, even more money would have to be printed than before. But the real problems keep getting worse, while aggregate output is increasing.
What is the net effect? The net effect is that the supply of money would have to become an ever growing multiple of NGDP. More money is held for longer because of the real problems that are accumulating as NGDP is forced artificially upwards via accelerating inflation.
In a free market, if there are ever real problems, those problems would tend to be exposed sooner rather than later, in such a way that encourages changes to real activity which encourage falling prices and spending. With artificially goosed spending that ignores real problems caused by inflation, those problems are prevented from being exposed sooner rather than later, and as a result, problems are compounded.
What are these problems? These problems are capital allocations not in temporal and/or cross sectional coordination with individual consumption/saving patterns. Inflation causes these problems.
If a central bank is unwise, then it would inflate more to reverse the rise in cash holding times that are themselves caused by past inflation that caused the problems MMs believe requires inflation to solve.
1. February 2014 at 15:14
Professor Sumner,
You said: “J, Why does that argument not apply to unemployment, which does not have a unit root?”
I don’t know enough about the data/econometrics to give a complete answer, but there are many ways in which unemployment and RGDP growth diverge. For example, unemployment can fall if people drop out of the work force, which puts a downward ‘bias’ in unemployment forecasts.
Anyway, we obviously don’t completely understand macroeconomic theory, but have a better understanding of econometrics. These are purely econometric results. Optimal forecasts are what they are, and it’s sometimes hard to understand from where they come. The whole argument between Krugman and Mankiw was due to miscommunication because it seems that Krugman misinterpreted Mankiw as drawing policy implications (don’t worry about demand-side economics), which he was not.
1. February 2014 at 17:01
Scott Sumner– in his latest post David Beckworth contends that the increase in the money base should be permanent. Does this not mean that increases in the Fed balance sheet should be permanent? What would matter if the Fed had a $5 trillion balance sheet in perpetuity?
1. February 2014 at 17:19
Travis, I’d say very little from either. It’s mostly been the self-correcting mechanism as wage grow slows in response to the negative NGDP shock.
MFFA, I think he believes the eurozone is in the zero rate trap even when the ECB is raising interest rates. I don’t understand that.
J, I agree with your comment.
Ben, I think just enough should be permanent to get NGDP up to 5%, the rest should be temporary.
1. February 2014 at 18:03
Prof. Sumner,
GREAT answer, thanks! I think that puts a lot of Mark Sadowski’s multiple comments in the previous post into context:
http://www.themoneyillusion.com/?p=25854#comment-316441
1. February 2014 at 19:21
Dr. Sumner,
Wouldn’t be wiser to just say that the FED has not upset the drop in velocity and that is why the CPI will stay low regardless of the size of the balance sheet?
Saying the the FED has had tight money (which I agree) makes it difficult for non-MM to even begin to grasp the fact.
1. February 2014 at 19:40
Ben,
I would appreciate some correction if I am wrong, but if we see the rate of growth of the monetary base, only 7% of the time the change on the base has been negative. So the balance sheet almost never shrinks.
http://research.stlouisfed.org/fred2/graph/?id=BASE
1986-01-01 10.5 2000-01-01 -3.6
1987-01-01 6.0 2001-01-01 8.8
1988-01-01 7.0 2002-01-01 7.3
1989-01-01 4.5 2003-01-01 5.3
1990-01-01 9.7 2004-01-01 4.5
1991-01-01 8.6 2005-01-01 3.3
1992-01-01 10.8 2006-01-01 2.6
1993-01-01 10.8 2007-01-01 1.2
1994-01-01 7.3 2008-01-01 99.8
1995-01-01 4.5 2009-01-01 18.0
1996-01-01 5.3 2010-01-01 -0.6
1997-01-01 6.6 2011-01-01 29.1
1998-01-01 6.0 2012-01-01 2.9
1999-01-01 17.6 2013-01-01 39.4
Actually, now that we are looking at the great results of monetary offset, future contractions of fiscal policy would just make the size of the balance sheet more irrelevant.
1. February 2014 at 19:45
I found this graph:
http://en.wikipedia.org/wiki/File:U.S._Federal_Reserve_-_Treasury_and_Mortgage-Backed_Securities_Held.png
Was the FED selling treasuries during 2008? That would be contractionary, isn’t?
1. February 2014 at 20:50
The idea of unit root is strongly dependent on knowing the trend that is supposedly stationary … here is an example:
http://informationtransfereconomics.blogspot.com/2014/01/rgdp-growth-does-not-have-unit-root.html
Even if you don’t believe the model, it shows that a given trend can result in RGDP growth not having a unit root, but another trend does have one based the same unit root test (Dickey-Fuller).
1. February 2014 at 21:02
@tesc
It is likely the value of the treasuries it held was crashing faster than they were purchasing them.
1. February 2014 at 22:18
Scott, with respect to the FRED graph of real GDP growth rates, you write, “The 1950s sure look like trend reversion to me.”
The presence of rend (or mean) reversion in real GDP growth rates tells us little about the unit root hypothesis for real GDP because trend reversion in growth rates is consistent with both trend stationarity in real GDP and a unit root in real GDP. The real GDP unit root hypothesis refers to real GDP in levels, not in growth rates. To reverse the argument, regardless of whether real GDP in levels has either a unit root or is trend stationary, in first differences real GDP has mean (or trend) reversion.
Your observation that real GDP growth rates appear to slow down after a recession suggests that the growth rate might have a unit root and would thus be integrated of order 1. Then real GDP in levels would be intgrated of order 2 (requiring differencing twice to get it stationary).
2. February 2014 at 00:29
TESC–
You raise a fascinating question in your last comment, one that almost no one ever talks about. The Fed had a larger balance sheet running into 2008, then sold a lot of it off. About $400 billion worth. Something about supplying the demand of the market for safe securities.
If some economics smarties out there want to explain that, and its ramifications, I would like to hear about it.
As to my statement, what I am implying is that the Fed should not worry about the size of its balance sheet, and if it grows to $5 or $6 trillion so be it, as long as inflation stays in check.
Not only that, the Fed should signal it plans to keep its hoard of bonds—that it is in fact boosting the money supply permanently, a one-time shock.
The strange thing is that the Fed acquiring and keeping a large hoard of US Treasuries would be a boon for taxpayers, and wipe out trillions in federal debt. But no one ever talks about that–it is a taboo topic, or something. Even Market Monetarists never want to talk about this.
I suspect no one wants Congress to figure they can just print money and build bridges to nowhere, or bullet trains or F-35 fighter jets for free. Yes, that would be a road to inflation, and monetizing the debt as standard. Also, right-wingers just hate the idea of people not suffering for perceived excesses. Macroeconomics as a morality play (with some accountability issues blurred, but….)
But as a technique to recover from recessions, especially financial-bust recessions…monetizing the debt seems a-okay.
2. February 2014 at 04:10
Benjamin Cole,
You ask what’s the optimum size of the Fed’s balance sheet and the national debt. MMTers worked that one out long ago. The answer is thus.
National debt and monetary base are private sector assets (and liquid ones to boot). The bigger the size of those assets, the more the private sector will spend. Now what’s the optimum level of spending? It’s the level that brings the maximum level of employment that is compatible with not too much inflation. So that’s your question 90% answered.
The only remaining question is: what’s the optimum rate of interest to pay on the debt? That can be altered anytime by having the Fed sell or buy debt. I’d say (and Warren Mosler says) “about zero” in real terms, which is where the rate has been for the last few years for countries that are run in a reasonably responsible way: i.e. the US, UK, Germany, Japan, but definitely not Greece or Argentina.
2. February 2014 at 05:47
Ralph Musgrave:
Thanks for your response.
I have heard the argument that the size of the national debt does not matter.
But dang it, we have to tax people–productive people–to raise funds to met the debt payments (on top funding the pure waste that is DC).
And if debt rises and rises, then debt payments rise and rise. More work disincentives.
Now, maybe–I am not sure–but maybe it we have only consumption taxes, then there would be a less reason to be spooked by high debt levels.
People would still have incentives to work, and that is what counts the most.
But in general, I go with lower taxes are better taxes–this is economic sense, no?
Now, on the size of the Fed’s balance sheet–here I see an oddity that is verboten to discuss in economic circles. The Fed is paying off the debt, with cash.
Good idea I say.
This means lower than otherwise taxes and better work incentives, all things being equal.
Seems to me the Fed needs to be integrated with the Treasury Department and a sustained QE program institutionalized. What if monetized debt equal to new debt issued for the next 20 years?
2. February 2014 at 07:31
Krugman calls emerging market valuations a “bubble.”
http://www.businessinsider.com/paul-krugman-on-em-2014-2
Hmmmmmmmmmm………….
2. February 2014 at 10:08
tesc and Benjamin Cole,
There was never any need to exit from the more than six-fold increase in the monetary base that took place in 1932-48. The most that the monetary base decreased was from $48.413 billion in December 1948 to $42.960 billion in April 1950, or by 11.3%. And even that decrease probably had only minimal negative consequences because of the expected decline in real output following World War II.
So given the history of the last time the Federal Reserve spent an extended period of time at the zero lower bound, as well as the availability of newer monetary policy tools (e.g. interest on reserves), I seriously doubt that an exit from QE will be necessary, much less desirable.
Also, with respect to the selloff in Treasuries in 2008, I too have heard the “safe asset” explanation from MMT/MR types, but that sounds like self-serving baloney to me.
The reality is that the Fed initiated its credit and liquidity programs in December 2007 in response to the snowballing financial crisis. Initially these programs were fully sterilized in order to prevent the monetary base from growing. This only changed after Lehmans filed for bankruptcy in mid-September 2008.
I have assembled all of the relevant data series involved in the Fed’s credit and liquidity programs here:
http://research.stlouisfed.org/fred2/graph/?graph_id=147243&category_id=0
The following is the sum of the amounts in the Fed’s credit and liquidity programs, the monetary base (SBASENS), and the difference in billions of dollars.
Date””””-C&LP-Base-Diff.
2007-11-01″”-0-835-835
2007-12-01″”-4-836-832
2008-01-01″”68-832-764
2008-02-01″”77-830-753
2008-03-01″”70-834-764
2008-04-01-276-830-554
2008-05-01-318-837-519
2008-06-01-324-839-516
2008-07-01-350-849-500
2008-08-01-366-849-483
2008-09-01-420-913-493
2008-10-01-1110-1113″”-3
2008-11-01-1545-1459-(-86)
2008-12-01-1687-1670-(-17)
2009-01-01-1520-1715-195
2009-02-01-1331-1561-230
2009-03-01-1293-1639-346
2009-04-01-1168-1760-592
2009-05-01-974-1776-802
2009-06-01-784-1680-896
2009-07-01-611-1674-1063
2009-08-01-490-1706-1215
2009-09-01-444-1798-1354
2009-10-01-379-1942-1564
2009-11-01-311-2025-1713
2009-12-01-250-2024-1774
2010-01-01-210-1997-1787
2010-02-01-172-2119-1947
2010-03-01-153-2076-1923
2010-04-01-145-2016-1871
2010-05-01-142-2011-1869
2010-06-01-139-2000-1860
2010-07-01-134-1996-1861
2010-08-01-131-1992-1861
2010-09-01-121-1960-1839
2010-10-01-116-1965-1850
2010-11-01-115-1971-1856
2010-12-01-112-2015-1903
2011-01-01-100-2044-1944
2011-02-01″”88-2211-2124
2011-03-01″”85-2396-2312
2011-04-01″”82-2502-2420
2011-05-01″”80-2567-2487
2011-06-01″”75-2646-2571
2011-07-01″”70-2685-2615
2011-08-01″”63-2658-2595
2011-09-01″”60-2635-2576
2011-10-01″”58-2642-2584
2011-11-01″”52-2604-2552
2011-12-01-100-2619-2519
2012-01-01-142-2638-2495
2012-02-01-147-2700-2552
2012-03-01-100-2652-2552
2012-04-01″”65-2644-2579
2012-05-01″”53-2612-2558
2012-06-01″”46-2620-2574
2012-07-01″”46-2651-2605
2012-08-01″”39-2648-2609
2012-09-01″”23-2595-2572
2012-10-01″”16-2613-2597
2012-11-01″”15-2647-2632
2012-12-01″”14-2673-2660
2013-01-01″”10-2740-2730
2013-02-01″”-7-2841-2834
2013-03-01″”10-2940-2930
2013-04-01″”10-3015-3005
2013-05-01″”-8-3116-3107
2013-06-01″”-3-3197-3194
2013-07-01″”-3-3293-3290
2013-08-01″”-3-3398-3395
2013-09-01″”-2-3488-3486
Note that the difference between the credit and liquidity programs and the monetary base didn’t recover to the level it had been in November 2007 until June 2009, just as the economy troughed. Coincidence? Probably, but it’s still very interesting, and worth looking into further.
2. February 2014 at 10:49
Benjamin,
Re taxing people to pay interest, as I said above, the REAL or inflation adjusted rate of interest can perfectly well be maintained at near zero. And those who don’t buy government debt are initially EXCUSED paying tax to the extent that government is funded by those who DO BUY the debt. So that’s a big initial “plus” for the non-debt buyers. The latter then DO PAY some interest. But when it comes to repaying the capital sum, inflation has whittled away the real value of that capital sum. (That over-simplifies the issue a bit, but never mind.) So for those taxpayers you’re concerned about, it all boils down to a big non-event.
Re “debt rises and rises”, it HAS BEEN steadily rising in dollar terms for the last century, but the sky hasn’t fallen in. As to the debt/GDP ratio that hasn’t changed much over the very long term because of inflation and rising real GDP.
Re merging the Fed and Treasury, there are plenty of people and groups in favour of that. MMTers keep pointing out that so far as REAL ECONOMIC EFFECTS go, there is no point in distinguishing between the two.
As to your last sentence, that is abandoning debt issuance and issuing only base money, that was advocated by Milton Friedman, and I don’t have any big objections to his idea. See paragraph starting “Under the proposal…” (p.250) here:
http://nb.vse.cz/~BARTONP/mae911/friedman.pdf
2. February 2014 at 11:51
Thanks Travis.
Tesc, We need to get people to stop focusing on the base and start focusing on NGDP as an indicator of the stance of monetary policy.
Jason, Yes, the estimates are very fragile.
David, I understand that it is about levels, but it also implies that when you are in a recession you cannot expect faster than average growth going forward. But I agree that simply looking at the 1950s doesn’t prove anything. It would be more accurate to say that the past few decades look like a unit root period.
2. February 2014 at 12:21
Sumner, you are right, it is just ridiculously funny how difficult it is.
Mark you are right, IOR is the key. A friend was concern about inflation because of the size of the base or the size of the balance sheet using Ben’s question. I just told him that thanks to IOR any inflation fear is stop by raising IOR from one moment to another.
People, and even the FED itself, have a hard time grasping the power of the FED.
2. February 2014 at 13:55
Mark S
Incredible work by you once again.
Ralph Musgrave–interesting ideas.
2. February 2014 at 14:43
Scott, thanks for the response. My apologies for not quite seeing what you were driving at. Yes, you’re right, in principle to argue against the unit root one could try to see whether or not growth rates were unusually high for a while after recessions. And one would also need to check for unusually low growth rates after booms (which, making this a bit harder, don’t get their own highlighting on these graphs). I think it’s hard to get much clear evidence about this in eyeballing a graph – noise will likely confound the effort. But, as far as recessions are concerned, I do see what you see – there does seem to be more of a tendency for not unusually high growth after the more recent recessions than after the older ones. (But I’m already fairly well convinced of the truth of the unit root hypothesis.)
2. February 2014 at 22:41
Jason it’s worth pointing out that unit root tests in general, and especially Dickey-Fuller tests, are very low power.
So during debate about these things the output of such tests is never (and may never be) convicing enough to settle the argument.
3. February 2014 at 12:21
David, And I agree that eyeballing is a very crude test.