

Yes, expansionary monetary policy really did cause the 1970s inflation.
In a new post, Steve Waldman suggests that the inflation of the 1970s was not a monetary phenomenon. I have two issues with Steve’s post. One is that (in my view) he is actually arguing that it was a monetary phenomenon, but he characterizes the argument differently from the way I would. That is, he suggests the monetary stimulus was done for a reason; to prevent high unemployment. In his view that made it a non-monetary phenomenon. I recently criticized a Matt Yglesias post on the same grounds. He had claimed hyperinflation was not a monetary phenomenon, because the expansionary monetary policy was done for a reason (monetizing debts.) Of course by that logic fiscal stimulus did not boost the economy in the early 1940s.
But there is another problem with the Waldman post. The monetary stimulus that was applied was far in excess of what was needed to prevent high unemployment during the 1970s.
The easiest way to see this is to imagine a scenario where Waldman was right. Suppose the Fed was targeting nominal wage growth, in order to maintain stable employment. And let’s assume that productivity growth slowed in the 1970s, which it did. Then Steve would have a point. Real wages would have to fall, and that would occur through higher inflation (since the path of nominal wages is stable, by assumption.) In that case a very reasonable policy of nominal wage rate targeting would lead to higher inflation during low productivity periods such as the 1970s, just as Waldman hypothesized. So it’s not a bad theory.
The problem is that he didn’t investigate the theory deeply enough. Something can be qualitative correct, a nice story (story in the best sense of the word) and yet still not have enough power to explain the data. And the big problem with Steve’s story is that the Fed did way too much stimulus, even if they were trying to stabilize the path of nominal wages. Here’s the average growth rate in the wage rate starting in January 1964:
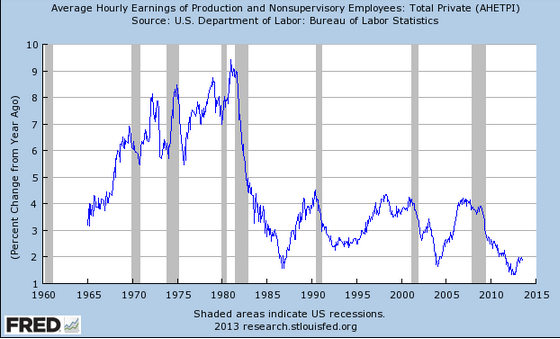
This led to the famous shifting Phillips Curve phenomenon, which (after a lag of a few years) completely negated the effects of steadily higher (wage) inflation.
Still, I’d like to end on a positive note. There are some theories that help us to understand why the Fed blew it in the 1966-81 period:
1. Assumption of stable Phillips Curve.
2. Mis-estimation of the natural rate of U, which was rising.
3. Confusion between nominal and real interest rates.
Waldman’s theory deserves to be added to that list. It’s not the whole story, but it’s a significant piece of the story. Note that wage growth peaked at 9%. That’s a better indicator of the size of the Fed’s error than inflation, which peaked at over 13%.
PS. I seem to recall the original Phillips curve was done with wage inflation, before evil American economists (Samuelson?) switched it over to price inflation. Big mistake.
HT: Michael
Tags:
6. September 2013 at 05:35
As we say the Fed moves last…
Since the Fed can neuter or allow fiscal stimulus, the Fed owns it when their MP allows bad fiscal to happen.
That’s the 30K ft story of 66-81.
The brilliance of NGDPLT is that it a far more brutal task master to Federal Govt. than even the ECB is now.
6. September 2013 at 06:25
Scott, do you feel that the end of bretton woods contributed to inflation? The inflation surge was somewhat global in scope. If so, how?
6. September 2013 at 08:02
Scott, I was thinking about Steve’s theory, and thoght maybe the median hourly wage is a better target than the mean.
Think about how inflation would help ajusting real wages is the distribution kept the same mean, but the median wage needed to go down.
This suports his theory that a lot of people entering the labor market needed mora inflation. This should skew the distribution to the left.
6. September 2013 at 08:13
The increase in average hourly wages peaks at 9%, whereas average inflation peaked significantly higher somewhere nearer 15%, so Steve’s point that there was bound to be a significant loss in real purchasing power is surely valid.
Nevertheless, its interesting to think about what the “best” monetary policy would have been at that time. Personally I think a 5% NGDPLT would have been too tight, given the expansion of the labour force. Perhaps you could put up a graph of what NGDP would have looked like at a 5% level target, and a what 5% target of NGDP/Working Age population would have looked like, compared to actual NGDP.
6. September 2013 at 08:28
“2. Mis-estimation of the natural rate of U, which was rising.”
Edward Nelson has a good number of articles arguing that it was this, rather than the Phillips Curve, which was the key factor behind the 1970s inflation. The Fed continually got output gaps wrong and also suffered from cost-push views due to disillusionment with the Phillips Curve; the PC was clearly an unreliable tool long before the 1970s inflation really got underway; as late as 1980, the WSJ was calling for another incomes policy.
Confusion over the nominal/real interest rate is astonishingly persistent, e.g. people talk about UK monetary policy being loosened in 1981 on the basis that interest rates fell, but real interest rates actually rose, as did NGDP growth (from about 17% in 1980 to about 10% in 1981).
In the UK, where nonmonetary explanations of inflation were the orthodox view until well into the 1980s, this tendency to cost-push views was very important and persisently led macroeconomic policy astray until 1979. The PC was never an important idea in UK economic policy, except ironically that Phillips Curve entered policymaking after 1979, but of course this was the expectations-adjusted PC.
Batini and Nelson’s 2005 paper “The UK’s Rocky Road to Stability” is a good summary of UK policy in the post-war period, including the 1970s, if anyone’s interested- http://research.stlouisfed.org/wp/2005/2005-020.pdf
6. September 2013 at 08:36
Inflation was a global phenomenon after 1971 or so. (There may be elements of an international monetary prisoner’s dillemma with easy- or tight- money — every nation must have printed too much at the end of BW, or international price-setting is stronger than we might imagine.)
http://research.stlouisfed.org/fred2/graph/?g=m8s
6. September 2013 at 09:00
Add to the Annals of Intellectual Confusion file (from two LSE guys):
http://www.voxeu.org/article/political-challenges-macroprudential-agenda
‘In fighting inflation, the central bank has one explicit tool at its disposal – interest rates – as well as an unambiguous and easily measured objective – inflation.’
Too bad, because they seem to be making a fair point; central banks should stick to conducting monetary policy and leave banking regulation to others.
6. September 2013 at 09:42
This is a very good post.
It is very common for a Brazilian economist to read about inflation caused by “distribution conflicts”, or any other structural cause. It always seemed to me that inflation was a monetary phenomenon anyway, because, in the end, the a priori change in prices and wages, or expected future prices and wages, will have to be sanctioned by the monetary authority in order for you to get inflation. If not, you get recession.
But as politics and the society may not tolerate a recession, maybe it is worth to saparate the origin of the phenomenon in two: 1) the monetary authority wants to push for higher inflation, and to reduce unemployment. 2) the monetary authority have no option other than accepting the price level pushed by society.
Do what I said make any sense?
6. September 2013 at 09:50
The problem with the idea that demographics or lackluster productivity growth is driving NGDP growth is that NGDP growth was nearly universally too fast in the advanced world in the late 1960s through the early 1980s and yet not every country was undergoing a boom in labor force growth or suffering from slow productivity growth.
The following annual data comes from AMECO (NGDP from 1960), the OECD (civilian labor force from 1955/1956) and the Conference Board (RGDP from 1950).
Here are some counterexamples.
1) West Germany
Peak NGDP growth is 141.1% in 1967-77 when civilian labor force growth was 2.4%. Peak civilian labor force growth is 10.4% in 1980-90 when NGDP growth was 65.7%.
2) UK
Peak NGDP growth is 344.4% in 1971-81 when civilian labor force growth was 6.2%. Peak civilian labor force growth is 10.0% in 1998-2008 when NGDP growth was 63.2%.
3) Spain
Peak NGDP growth is 476.7% in 1970-80 when civilian labor force growth was 5.4%. Peak civilian labor force growth is 33.7% in 1997-2007 when NGDP growth was 109.1%.
4) Netherlands
Peak NGDP growth is 224.6% in 1966-76 when civilian labor force growth was 8.3%. Peak civilian labor force growth is 19.8% in 1992-2002 when NGDP growth was 73.4%.
5) Sweden
Peak NGDP growth is 210.9% in 1973-83 when civilian labor force growth was 10.5%. Peak civilian labor force growth is 13.0% in 2002-12 when NGDP growth was 45.5%.
6) Austria
Peak NGDP growth is 180.5% in 1967-77 when civilian labor force growth was (-3.2%). Peak civilian labor force growth is 15.4% in 1985-95 when NGDP growth was 69.3%.
7) Ireland
Peak NGDP growth is 513.8% in 1971-81 when civilian labor force growth was 12.2%. Peak civilian labor force growth is 46.1% in 1997-2007 when NGDP growth was 176.9%.
8) Luxembourg
Peak NGDP growth is 179.6% in 1964-74 when civilian labor force growth was 17.0%. Peak civilian labor force growth is 48.1% in 1998-2008 when NGDP growth was 114.6%.
Furthermore several of these nations had significantly higher productivity growth (RGDP per labor force member) when NGDP growth was at peak than when civilian labor force growth was at peak. West Germany, Spain, the Netherlands and Austria had productivity growth of 40.6%, 52.8%, 43.8%, 63.1% respectively during the decades when NGDP growth was at peak, and productivity growth of 10.6%, 10.2%, 12.9%, 13.1% respectively during the decades when civilian labor force growth was at peak.
Was there a depression in any of these countries when civilian labor force growth hit its peak despite the much slower rates of growth in NGDP? In particular was there a depression in those countries where productivity growth was also much slower?
West Germany, Spain, the Netherlands and Austria had unemployment rates of 5.0%, 8.3%, 3.1% and 3.9% respectively in 1990, 2007, 2002 and 1995 respectively. (These are harmonized unemployment rates with the exception of West Germany.) West Germany’s rate was not a record for the post-WW II period but it was higher than it had been prior to 1982. Spain’s unemployment rate was the lowest since 1979, nearly 30 years previously. The Netherland’s unemployment rate was lowest ever except for the previous year (2.6%) on records extending back to 1983. Austria’s unemployment rate has only been lower three times since then and never lower than 3.6%.
6. September 2013 at 12:41
jknarr, If by Bretton Woods you mean the $35 gold price peg, then the answer is yes.
Arthur, Yes, median might be better.
Phil, Did you read my post to the end?
W. Peden, I’d love to see that WSJ article.
jknarr, I’d add that the disperion of inflation between countries was also much greater back then.
Patrick, I agree.
Zamba, I don’t think they have to give in.
Mark, Great comment as usual. That nails it.
6. September 2013 at 15:58
Yep, Samuelson & Solow (1960). http://web.econ.unito.it/bagliano/macro3/samsol_aer60.pdf
They actually estimated (by eyeball IIRC) a curve on wage data, but translated it into a tradeoff between unemployment and price inflation, which for some reason was the bit that took off. Maybe because price inflation is a more obvious ‘bad’ to tradeoff with unemployment?
6. September 2013 at 16:11
Scott, this discussion prompted me to look at a counterfactual of past LFP if women had kept working at the same rates they had before the 1970’s. LFP in the 1960s & 70’s would have been in decline. A lot of the parallels between the decades are hidden by that one-time addition of women into the workforce, and the LFP decline is being exacerbated because female participation is now on a long, slow secular declining path, just like men’s has been for decades.
http://idiosyncraticwhisk.blogspot.com/2013/09/1970s-vs-2000s-gender-effect.html
6. September 2013 at 17:19
Okay, now we poo-poo on the Fed for the 1960s-70s and higher (but single digit) annual nominal wage growfh.
Sheesh—the real GDP of the USA increased by more than 20 percent in just the last four years of the 1970s.
So give me the 1970s Fed if the alternative is today’s Fed.
6. September 2013 at 20:26
I don’t understand why Waldman says the 70’s showed that inflation is not a monetary phenomenon. Perhaps he shows that the monetary expansion was appropriate, but not that it was not the cause of inflation. In fact he seems to me to confirm that monetary expansion was the cause of the inflation.
Maybe his post should be titled, “Sometimes, in a time of endogenously large labour increases, central banks should expand the monetary base more than otherwise and tolerate high inflation, to price people back into jobs”. We is more or less orthodox Scott right?
6. September 2013 at 20:29
Last sentence again;
Sometimes, in a time of exogenously large labor increases, central banks should expand the monetary base more than otherwise and tolerate high inflation, to price people back into jobs”. Which is more or less orthodox Scott right?
6. September 2013 at 20:57
Milton Friedman in “Money Mischief: Episodes in Monetary History”, pointed out that back during those ‘oil crisis’ years inflation surged in the USA, was flat in Germany, and fell in Japan, simultaneously. (Even though Germany and Japan were much more fully dependent on imported oil than the USA.)
That was while the USA did loose money to ease the impact of the oil price rises, Germany followed a no-inflation policy as always, and Japan followed through on a policy of disinflation that it had started before the oil price hikes hit.
So much for what caused what there.
6. September 2013 at 21:28
[…] Sumner replies to my claim that the great inflation of the 1970s wasn’t a monetary phenomenon by saying, […]
6. September 2013 at 21:42
Someone ought to get Sadowski over to Bentley.
6. September 2013 at 23:30
This has been an interesting exchange for a lawyer to observe. Although I’ve had little to due with any liability cases for over 30 years, I remember well those discussions of “causation” in first year torts class.
I see now that Waldman has responded to Sumner’s response. Per Waldman, this has just been one big misunderstanding based on different ideas of “causation”. In other words, “a simple failure to communicate”.
As I understand Waldman’s latest, he’s using a “but for” test in arguing that monetary policy didn’t cause the 1970’s inflation—demographics did. In other words, “but for” the demographic and resulting employment situation, expansionary monetary policy would not have been needed. Presumably, since the demographics came first, the monetary policy (although these responses also satisfy the “but for” test) wouldn’t have been the (proximate?) cause. Using the apparent logic that temporality determines “proximate causation”, one could also argue that since WWII caused the demographics and therefore that WWII was responsible for the 1970’s inflation and so forth, just like “The House that Jack Built”.
In the law, at least, “proximate causation” (the type one is held legally accountable for) is a limitation on “but for” causation. Simply because something “causes” another thing in a “Jack the House Built” sense, does not make it a “proximate cause”.
Waldman makes an attempt to assign proximate causation (in the legal sense I understand) to demographics. But, I think he’s failed on two counts (even perhaps with respect to “but for” causation): First, he seemed initially to assume that demographics was the *only* thing necessitating the monetary response (and the latter was initially hardly mentioned). He seems himself now to admit this was not the case. Second, he assumes that the monetary response was absolutely necessary and there really was no choice and therefore it could not have been the cause of inflation. Here, too, his case is rather weak.
Much of the confusion and unnecessary disagreements in economics seem to be proximately caused by the failure to communicate effectively. While economists don’t need to adopt the same vocabulary as lawyers, it might help to develop a system for clearly defining important terms and concepts (“austerity” and “stimulus” also come to mind). Lawyers have their statutes and their courts to give precision to terms. Psychiatry has the DSM. Etc. But, for economists, it seems still to be the law and language of the jungle.
6. September 2013 at 23:33
And, I’ve also had little to *do* rather than “due”…
Waldman’s latest, aptly titled “Agreeing in different languages” is here:
http://www.interfluidity.com/
7. September 2013 at 00:00
To amplify; In 1974-5 we had recession, the real output of the USA economy fell by 0.6 percent in 1974 and then 0.2 percent in 1975.
The next four years saw real—real!—growth of 5.4, 4.6, 5.6 and 3.1 percent.
in short, the real output of the USA economy rose by 20 percent in four years after the mid-1970s recession.
That is a honking boom, dudes. Surely, one end of macroeconomics is prosperity.
I will concede It is also true that inflation hit low double digits in the late 1970s—through the economy then was characterized by unions, little international trade, regulated industries (transportation, telecommunication, banking), large retailers (Sears, Penny’s) and Big Steel and Big Auto etc.
Structural impediments galore. Top tax rate 70 percent (it had been 90 percent in the 1960s). The rate of inflation in the 1970s may also have been overstated and a new method was instituted soon thereafter (the conspiracy nuts love that fact).
Hard to remember now, but Big Steel used to “announce” price hikes.
I am not saying low double-digit inflation is enjoyable, or even bearable.
But let’s also remember the 20 percent increase in real output at the end of the 1970s. Boom-times.
Thus, the simple story is not “the Fed blew it.”
I think the the story is “the Fed helped a honking 20 increase in real output, and perhaps overstimulated.”
The key question: Given the decrease in structural impediments in today’s economy, would robust Fed stimulus results in double digit inflation today?
I think not.
The Fed is afraid of ghosts. Thus, we have inflation on the pCE deflator near 1 percent. That is a long, long, long way from double digits.
7. September 2013 at 05:16
I am having a hard time finding info about the the original PC with wage inflation. Could anyone please share a link or a paper that explains the development of the PC with wage inflation?
7. September 2013 at 05:30
Declan, Interesting hypothesis.
kebko, Thanks for that info.
Ben, That’s a defensible argument.
Chris. That was my reaction.
Jim Glass, Actually inflation rose in almost every country in the 1970s, and fell in almost every country in the 1980s. What Friedman should have said was that the amount if rose and fell depended on monetary policy.
Vivian, Very good comment. And again, I’m waiting for those Keynesian posts entitled “The low unemployment of the 1940s was not a fiscal phenomenon” (It was caused by WWII.)
7. September 2013 at 06:59
TESC,
I’m not exactly sure what you are looking for, but here is a really nice paper which puts the Phillips Curve in a historical perspective extending all the way back to the 17th century:
http://richmondfed.org/publications/research/economic_review/1985/pdf/er710502.pdf
And here is William Phillips’ original paper:
http://people.virginia.edu/~lc7p/202/Phillips58.pdf
7. September 2013 at 07:39
[…] Randy Waldman delivers another Aha! post (and a followup reply to Scott Sumner) pointing out a huge driver of the 1970s Great Inflation — the rise in the labor […]
7. September 2013 at 07:40
[…] Randy Waldman delivers another Aha! post (and a followup reply to Scott Sumner) pointing out a huge driver of the 1970s Great Inflation — the rise in the labor […]
7. September 2013 at 07:49
[…] Randy Waldman delivers another Aha! post (and a followup reply to Scott Sumner) pointing out a huge driver of the 1970s Great Inflation — the rise in the labor […]
7. September 2013 at 08:04
[…] the comment section to my post Mark Sadowski dug up a lot of data on demographics in other developed countries during the Great Inflation, and […]
7. September 2013 at 10:44
Mark,
That is what I had in mind. I wanted to see the PC’s development before Samuelson’s tinkering with it. Since I believe price inflation is not easy to measure, that is why I agree that NGDP is a better indicator for the FED’s goals, I thought going back to study the link between unemployment and wage inflation might give us some forgotten insight.
Let’s see
Thanks
7. September 2013 at 13:25
Scott Sumner,
I’m pretty sure it was the WSJ; certainly some surprising right-wing newspaper in the early 1980s.
7. September 2013 at 14:04
[…] Sumner has weighed in (here and here). In the comments section of Scotts first comment on SRW Mark Sadowski shows that a bunch […]
7. September 2013 at 20:03
[…] posts lately about the inflation of the 1970′s… Steve Randy Waldman, Steve Roth, Scott Sumner and me. Here is a graph of the inflation during the […]
7. September 2013 at 20:06
[…] posts lately about the inflation of the 1970′s… Steve Randy Waldman, Steve Roth, Scott Sumner and me. Here is a graph of the inflation during the […]
9. September 2013 at 07:32
Jim Glass, Actually inflation rose in almost every country in the 1970s, and fell in almost every country in the 1980s. What Friedman should have said was that the amount if rose and fell depended on monetary policy.
Inflation declined in Japan during the 1970s, steadily from 1974 on. And Friedman did say this resulted from monetary policy, of course.
If you don’t believe Friedman, here’s a more recent paper on inflation in & the monetary policies of Germany and Japan in the 1970s:
http://www.ijcb.org/journal/ijcb07q4a2.pdf
10. September 2013 at 00:57
[…] Nunes [1, 2], Steve Roth [1,2], Mike Sax, Karl Smith [1, 2, 3], Evan Soltas, and Scott Sumner [1, 2], as well as a related post by Tyler Cowen. I love the first post by Karl Smith. My title would […]
10. September 2013 at 06:48
[…] Scott Sumner “” Yes, expansionary monetary policy really did cause the 1970s inflation. […]
10. September 2013 at 08:46
Jim, You said Japanese inflation fell in the oil crisis years. It soared in 1973-74. That was the oil embargo. I agree it fell afterwards.
29. September 2013 at 00:53
I think a lot of people are missing the point.
Wages are going to inflate significantly for one very good reason.
Western governments want them to. The whole point of QE is to inflate away government and private debt. This requires GDP and tax income to rise and the only way to achieve this is price inflation that will drive wage inflation thus increasing tax revenues.
Over the next few years years I expect wages to increase until the debt to GDP is back down to about 50%
The main driver for this will be the price of oil which has already increased considerably, look out for an oil price over $1000 a barrel at it’s peak.